Synthesis of new material at high pressure

Inquiry number
SOL-0000001138
Beamline
BL04B1 (High Temperature and High Pressure Research)
Scientific keywords
| A. Sample category | inorganic material |
|---|---|
| B. Sample category (detail) | crystal |
| C. Technique | X-ray diffraction |
| D. Technique (detail) | powder diffraction |
| E. Particular condition | high pressure (press), tensile loading, high-T (> 500 C) |
| F. Photon energy | X-ray (> 40 keV) |
| G. Target information | crystal structure, structural change, phase transition |
Industrial keywords
| level 1---Application area | environment, Chemical product, industrial material, others |
|---|---|
| level 2---Target | catalysis |
| level 3---Target (detail) | |
| level 4---Obtainable information | d-spacing (lattice parameter), crystal structure |
| level 5---Technique | diffraction |
Classification
A80.20 metal ・material, A80.30 inorganic material, A80.34 catalysis, M10.20 powder diffraction
Body text
Many studies have been investigated diamond synthesis under high pressures and high temperatures, resulting in large-scale synthesis of diamonds. However, many questions, such as the role of the catalyst, kinetics of the reaction and the possibility of a metastable phase, are still unanswered regarding the graphite-diamond transformation process under high pressures. Energy-dispersive X-ray diffraction using a large-volume press, SPEED-1500 is a powerful tool for the direct observation of the catalytic graphite-diamond conversion process at high pressure and high temperature. Figure shows a series of X-ray diffraction profiles of graphite-carbonate catalyst, K2Mg(CO3)2 system with increasing temperature at 9.3 GPa. When temperature was increased to 1450℃, a metastable hexagonal diamond peak was observed from the graphite peaks, and cubic diamond peaks began to appear over 1600℃. This result show that diamond formation using the carbonate catalyst is a different process from the behavior of the metal catalysts such as nickel or cobalt.
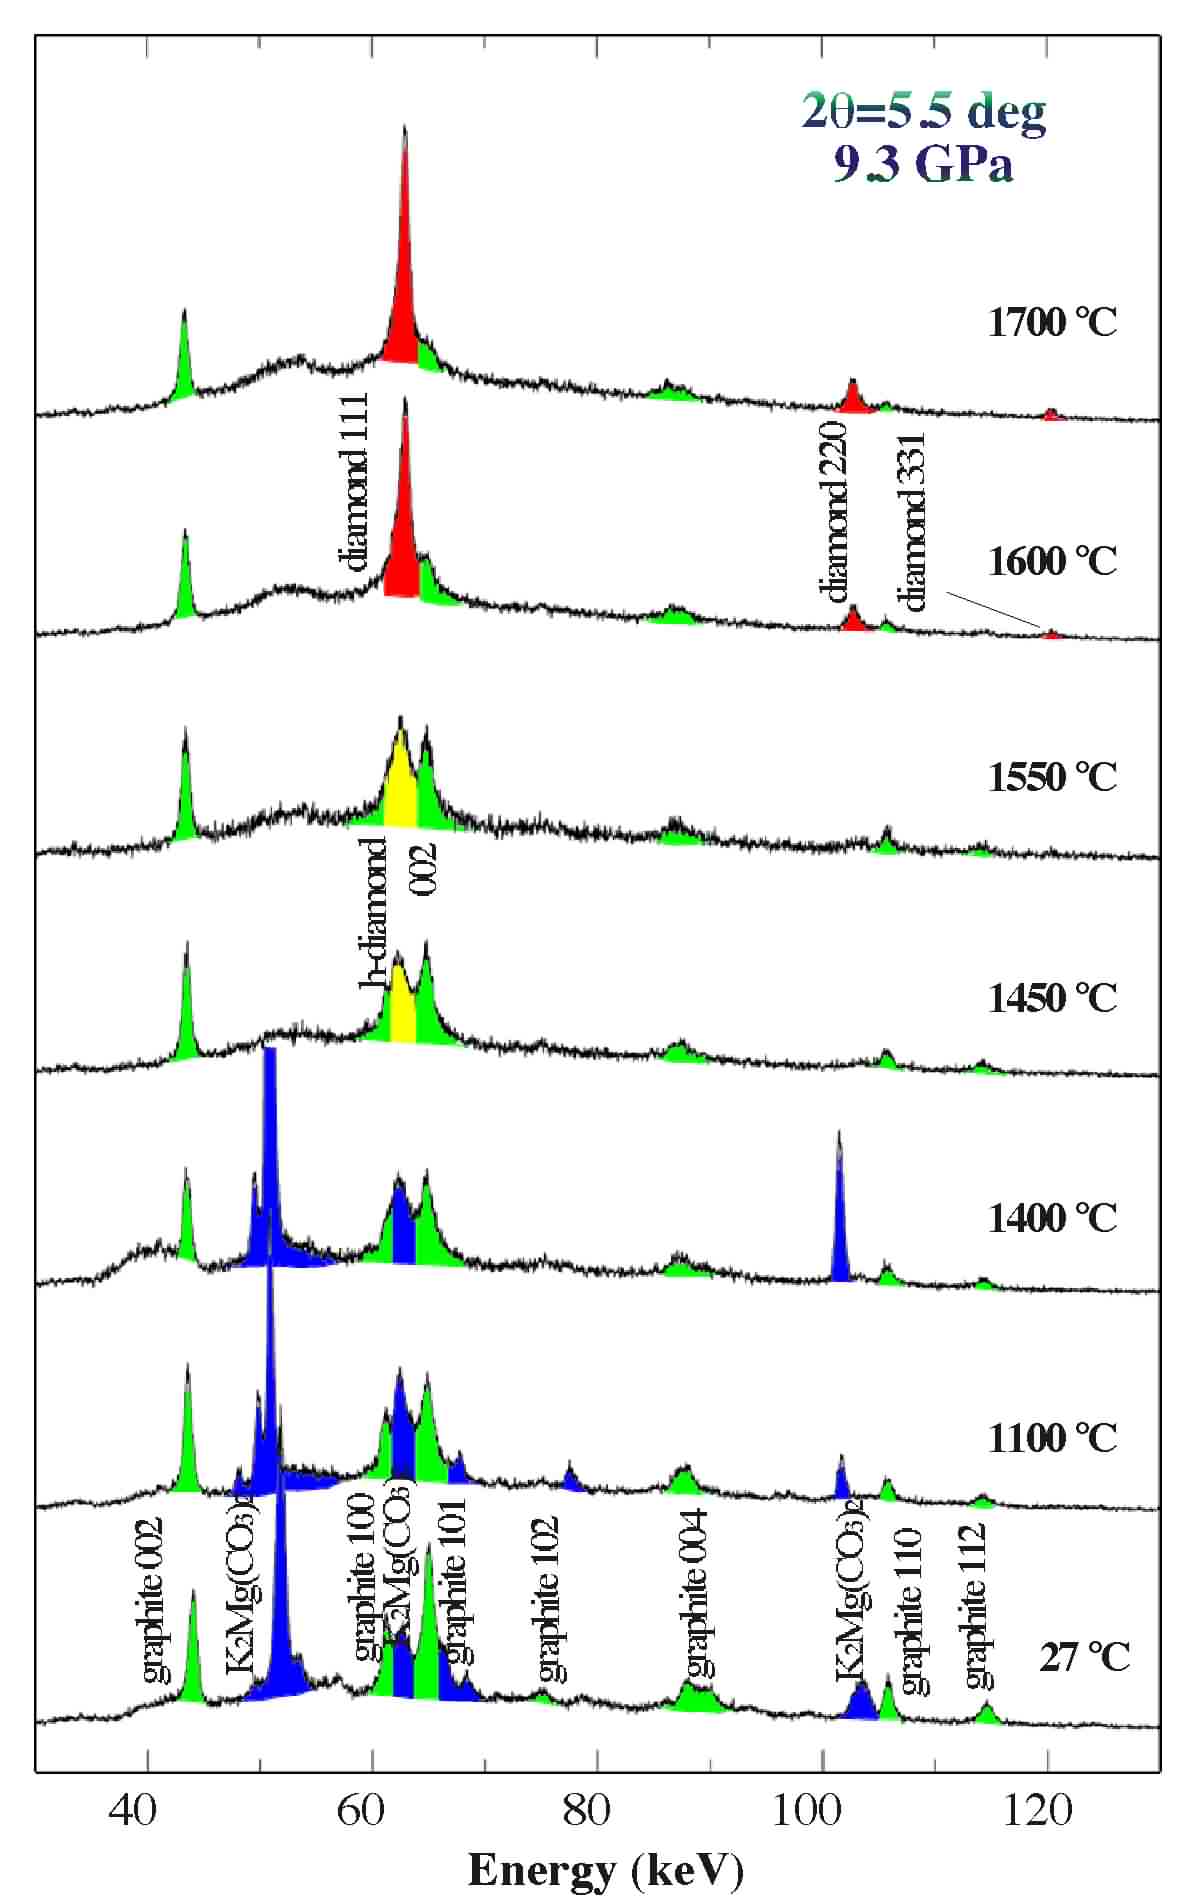
Fig. Variation of the X-ray diffraction profiles of graphite-K2Mg(CO3)2 system with increasing temperature at 9.3 GPa.
Source of the figure
Bulletin from SPring-8
Bulletin title
Research Frontiers (1998-1999)
Page
23
Technique
An energy-dispersive X-ray diffraction system attached to the Kawai-type large-volume press is shown in figure. A white X-ray beam from the bending magnet light source is collimated with vertical and horizontal slits to form a thin beam possessing a cross section of typically 0.05 x 0.1 mm2. In order to carry out the energy-dispersive X-ray diffraction on the Kawai-type system, the first-stage anvils are cut holes to pass the X-ray beam. The incident white X-ray beam from the first-stage passes through the gaps between the second-stage anvils in a horizontal plane. X-rays diffracted by samples under high-pressure and high-temperature is detected by a pure Ge solid state detector (Ge-SSD) with a 4096 multi-channel analyzer. Diffraction data can be obtained with an energy range from 20 to 150 keV. Use of a collimator (0.05 mm width) and a receiving slit at a fixed angle to the direct beam permits only the diffracted X-rays from the sample to be detected. The horizontal goniometer covers a range of 2θ angles from -10 to 23° with an accuracy of 0.0001°. The X-ray acquisition time to obtain a diffraction profile is typically one to several minutes.
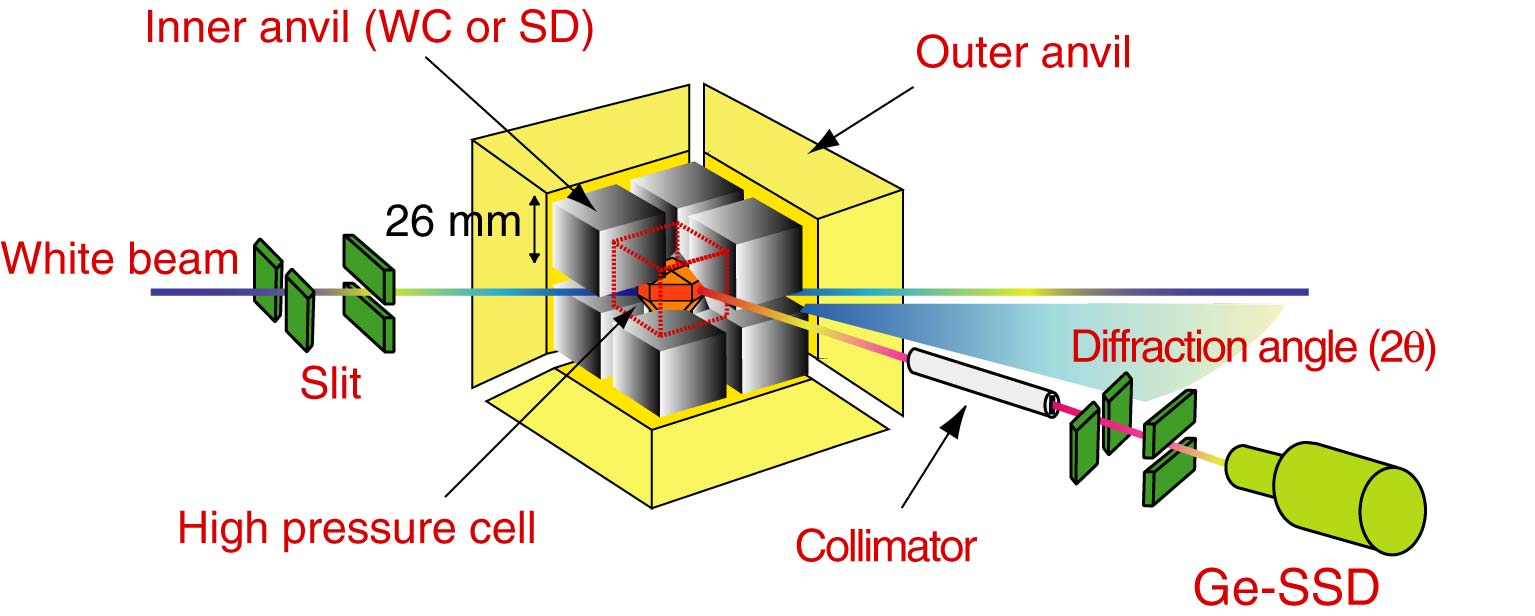
Fig. Schematic drawing of the energy-dispersive X-ray diffraction on the Kawai-type large-volume press.
Source of the figure
Beamline Report
Page
14
Required time for experimental setup
1 day(s)
Instruments
| Instrument | Purpose | Performance |
|---|---|---|
| SPEED-1500 | High pressure and high temperature experiment | 2500K, 30 GPa |
References
| Document name |
|---|
| J. Phys. Condens. Matter, 16, S1017(2004) |
Related experimental techniques
Questionnaire
The measurement was possible only in SPring-8. Impossible or very difficult in other facilities.
This solution is an application of a main instrument of the beamline.
Ease of measurement
With a great skill
Ease of analysis
Middle
How many shifts were needed for taking whole data in the figure?
Two-three shifts