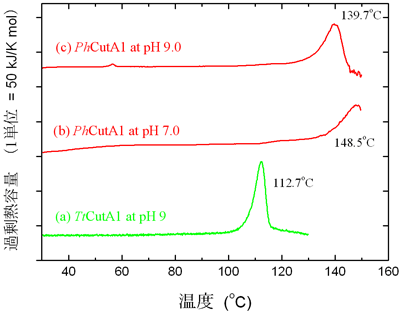
図1.PhCutA1とTtCutAのDSC曲線(昇温速度は60℃/時)
DSCカーブはタンパク質の変性に伴う熱吸収の量を示す。(a) pH 7.0でのTtCutAのDSC曲線(b) pH 7.0でのPhCutA1のDSC曲線(c) pH 9.0 でのPhCutA1のDSC曲線