焼却炉飛灰中の微量金属元素の化学状態分析
問い合わせ番号
SOL-0000001251
ビームライン
BL01B1(XAFS I)
学術利用キーワード
| A. 試料 | 無機材料 |
|---|---|
| B. 試料詳細 | 金属・合金, 非晶質、ガラス, 環境関連物質 |
| C. 手法 | 吸収、及びその二次過程 |
| D. 手法の詳細 | XAFS, XANES |
| E. 付加的測定条件 | 偏光(直線), 室温 |
| F. エネルギー領域 | X線(4~40 keV) |
| G. 目的・欲しい情報 | 化学状態, 局所構造, 元素分析(組成), 元素分析(微量) |
産業利用キーワード
| 階層1 | 建設, 環境 |
|---|---|
| 階層2 | 触媒, 環境物質 |
| 階層3 | 焼却灰 |
| 階層4 | 価数, 化学状態 |
| 階層5 | XAFS, NEXAFS |
分類
A80.40 環境材料, M40.10 XAFS
利用事例本文
本事例では焼却炉からでる飛灰について蛍光XANES測定を行い、飛灰に含まれる微量金属の化学状態を分析しました。蛍光XANES法は、多種元素が混在する試料中の微量の目的元素の電子構造(価数、近接原子種)や化学組成を解析できる強力な手法です。図に示すのは、種々の焼却炉飛灰中の微量Pb(0.6-1.1 wt%)について測定したPb L3吸収端XANESスペクトルです。参照試料のスペクトルを用いたXANESのパターンフィッティングにより、飛灰中のPbSやPbCl2等の化学種の存在比率が計算され、それらに影響する要因についての情報が得られました。
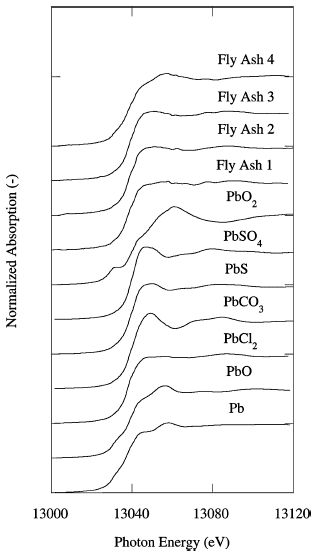
図 焼却飛灰と参照用標準物質のPb L3吸収端XANESスペクトル
画像ファイルの出典
原著論文/解説記事
誌名
Physica Scripta, T115, 943(2005)
図番号
1
測定手法
希薄試料のXANESスペクトルは、目的元素の吸収端近傍で、試料からの蛍光X線量をX線エネルギーの関数として測定することで得られます(蛍光XANES法)。1000 ppm程度以上の希薄試料の場合、検出器としてライトル検出器を用います。本事例の試料の場合、計測時間は、1測定あたり15分程度です。
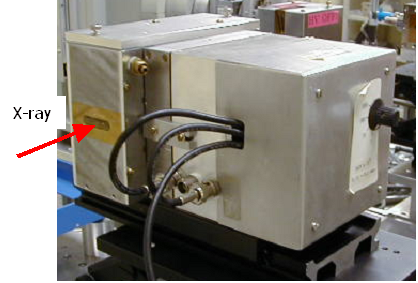
図 ライトル検出器の配置
画像ファイルの出典
私信等、その他
詳細
講習会プレゼン資料
測定準備に必要なおおよその時間
4 時間
測定装置
| 装置名 | 目的 | 性能 |
|---|---|---|
| XAFS測定装置 | XAFSスペクトルの計測 | 3.8-113 keV |
| ライトル検出器 | 希薄・薄膜試料の蛍光XAFSの測定 | 濃度:1000 ppm以上、膜厚:10 nm以上 |
参考文献
| 文献名 |
|---|
| M. Takaoka et al., Physica Scripta., T115 (2005) 943. |
関連する手法
アンケート
本ビームラインの主力装置を使っている
ユーザー持ち込み装置を使った
測定の難易度
中程度
データ解析の難易度
中程度
図に示した全てのデータを取るのにかかったシフト数
1シフト以下