Structure of glass at high pressure

Inquiry number
SOL-0000001175
Beamline
BL04B1 (High Temperature and High Pressure Research)
Scientific keywords
| A. Sample category | inorganic material |
|---|---|
| B. Sample category (detail) | insulator, ceramics, amorphous, glass |
| C. Technique | X-ray diffraction |
| D. Technique (detail) | powder diffraction |
| E. Particular condition | high pressure (press), tensile loading, high-T (> 500 C) |
| F. Photon energy | X-ray (> 40 keV) |
| G. Target information | structure analysis, structural change, phase transition |
Industrial keywords
| level 1---Application area | Semiconductor, industrial material |
|---|---|
| level 2---Target | silicon semiconductor, catalysis, glass |
| level 3---Target (detail) | gate insulator, interlayer insulator, capacitance insulator |
| level 4---Obtainable information | density, structure of non-crystalline material, interatomic distance |
| level 5---Technique | diffraction |
Classification
A80.30 inorganic material, M10.20 powder diffraction
Body text
Different structures of SiO2 glass such as the highly densified glass have been recognized, but the existence of a first-order phase transition depending on the pressure and temperature is controversial. Energy-dispersive X-ray diffraction using a large-volume press, SPEED-1500 make it possible to observe the direct structure change of glass and melt under high pressure and high temperature. Figure shows the temperature dependence of the structure factor, S(Q) of SiO2 glass at 3.7and 9.9 GPa. The large increase in density is attributed to a significant modification in the intermediate range order, which is manifested by a drastic change in the first sharp diffraction peak (FSDP). The change of FSDP at 3.7 GPa is small, while a large change in FSDP is observed at 9.9 GPa with increasing temperature.The results indicate that there is a P-T region where the intermediate range structure relaxed to a denser one.
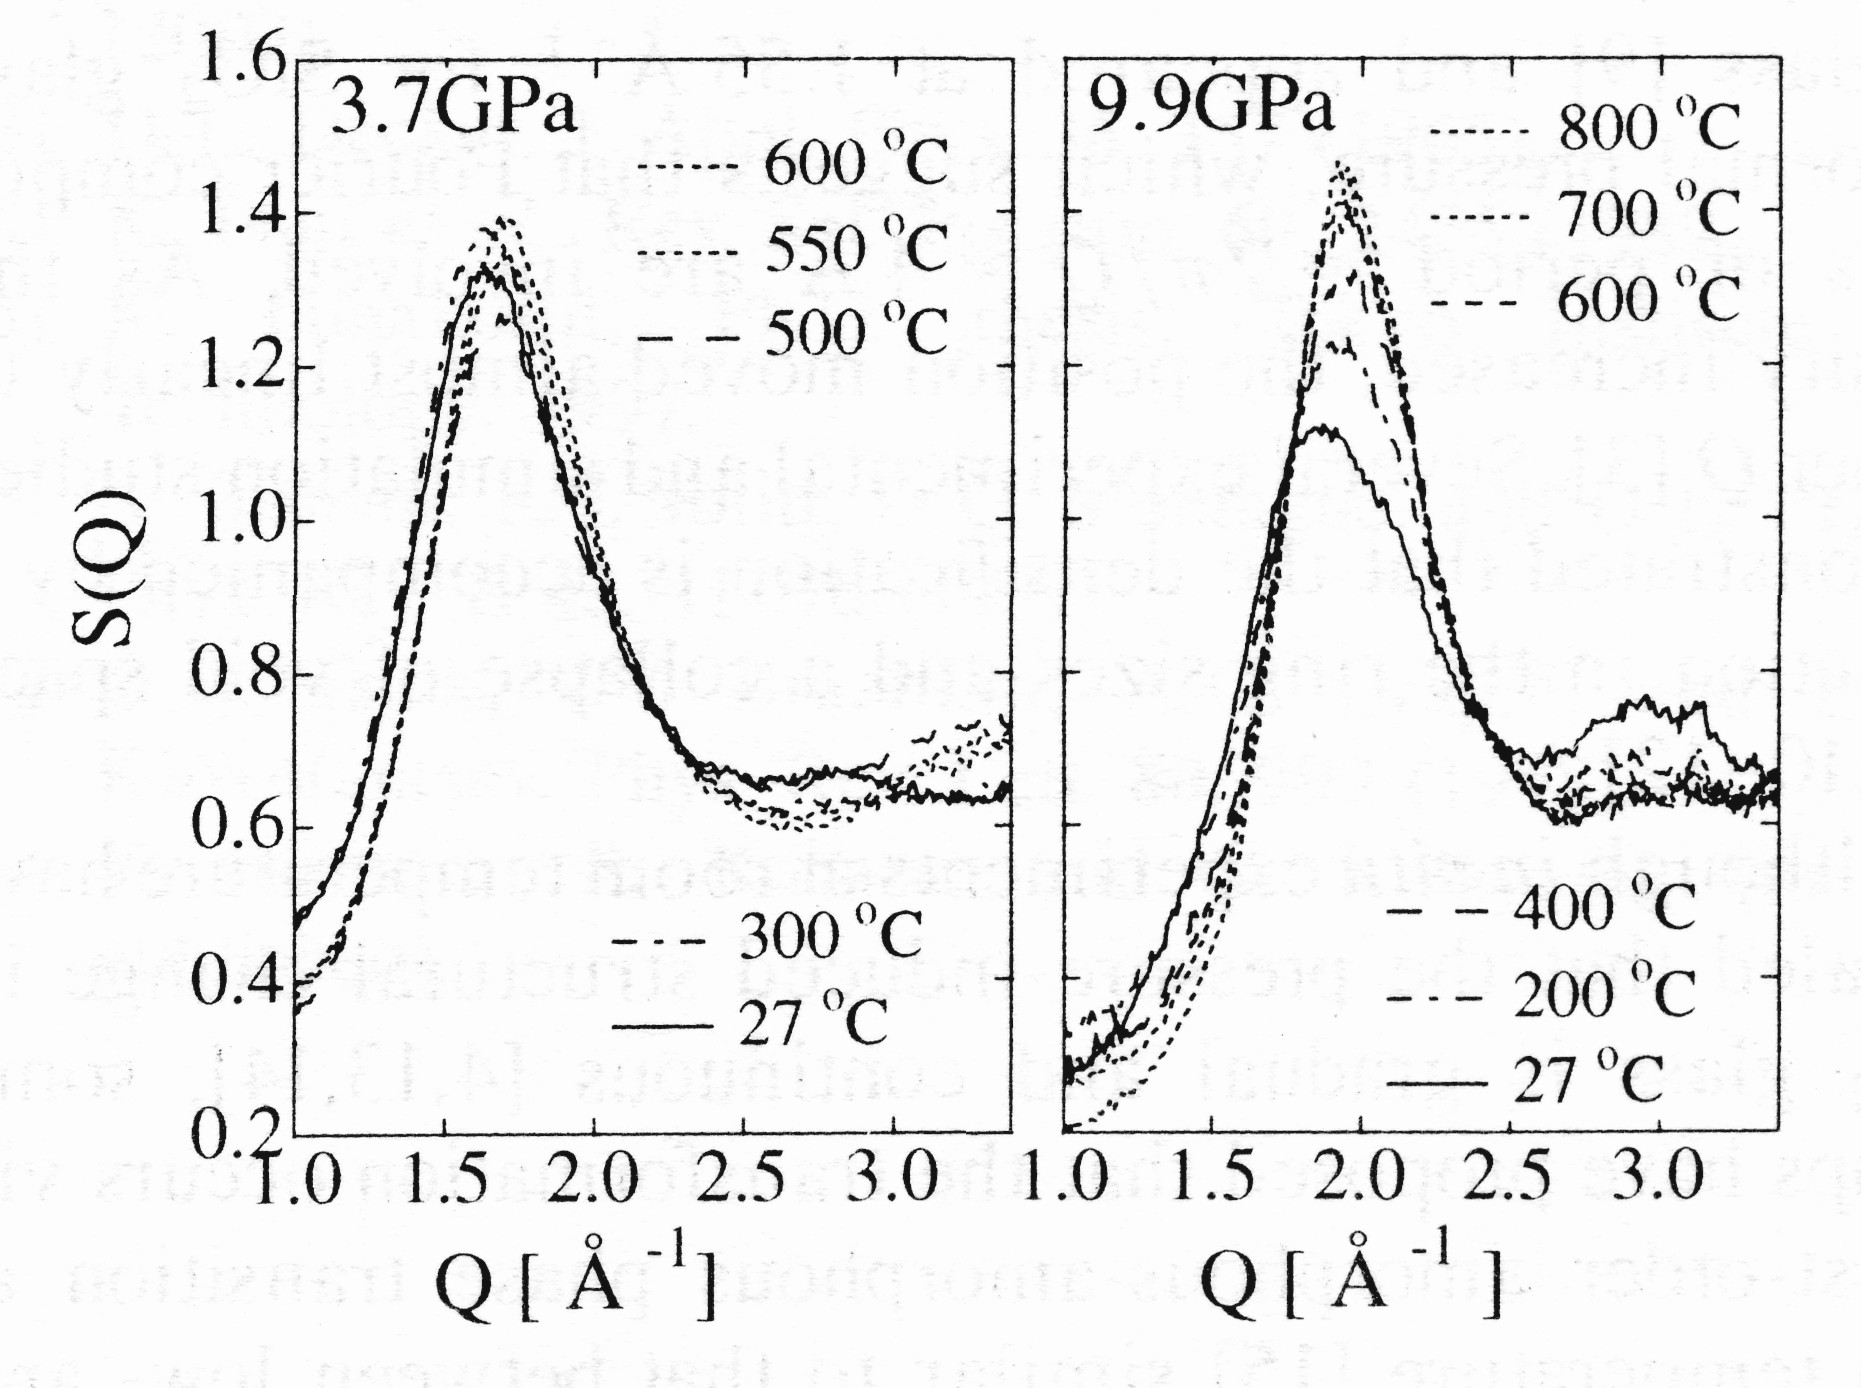
Fig. Temperature dependence of S(Q) of SiO2 glass at 3.7 and 9.9 GPa.
[ Y. Inamura, Y. Katayama, W. Utsumi and K. Funakoshi, Physical Review Letters 93, 015501 (2004), Fig. 3,
©2004 American Physical Society ]
Source of the figure
Original paper/Journal article
Journal title
Phys. Rev. Lett., 93, 015501(2004)
Figure No.
3
Technique
An energy-dispersive X-ray diffraction system attached to the Kawai-type large-volume press is shown in figure. A white X-ray beam from the bending magnet light source is collimated with vertical and horizontal slits to form a thin beam possessing a cross section of typically 0.05 x 0.1 mm2. In order to carry out the energy-dispersive X-ray diffraction on the Kawai-type system, the first-stage anvils are cut holes to pass the X-ray beam. The incident white X-ray beam from the first-stage passes through the gaps between the second-stage anvils in a horizontal plane. X-rays diffracted by samples under high-pressure and high-temperature is detected by a pure Ge solid state detector (Ge-SSD) with a 4096 multi-channel analyzer. Diffraction data can be obtained with an energy range from 20 to 150 keV. Use of a collimator (0.05 mm width) and a receiving slit at a fixed angle to the direct beam permits only the diffracted X-rays from the sample to be detected. The horizontal goniometer covers a range of 2θ angles from -10 to 23° with an accuracy of 0.0001°. The X-ray acquisition time to obtain a diffraction profile is typically one to several minutes.
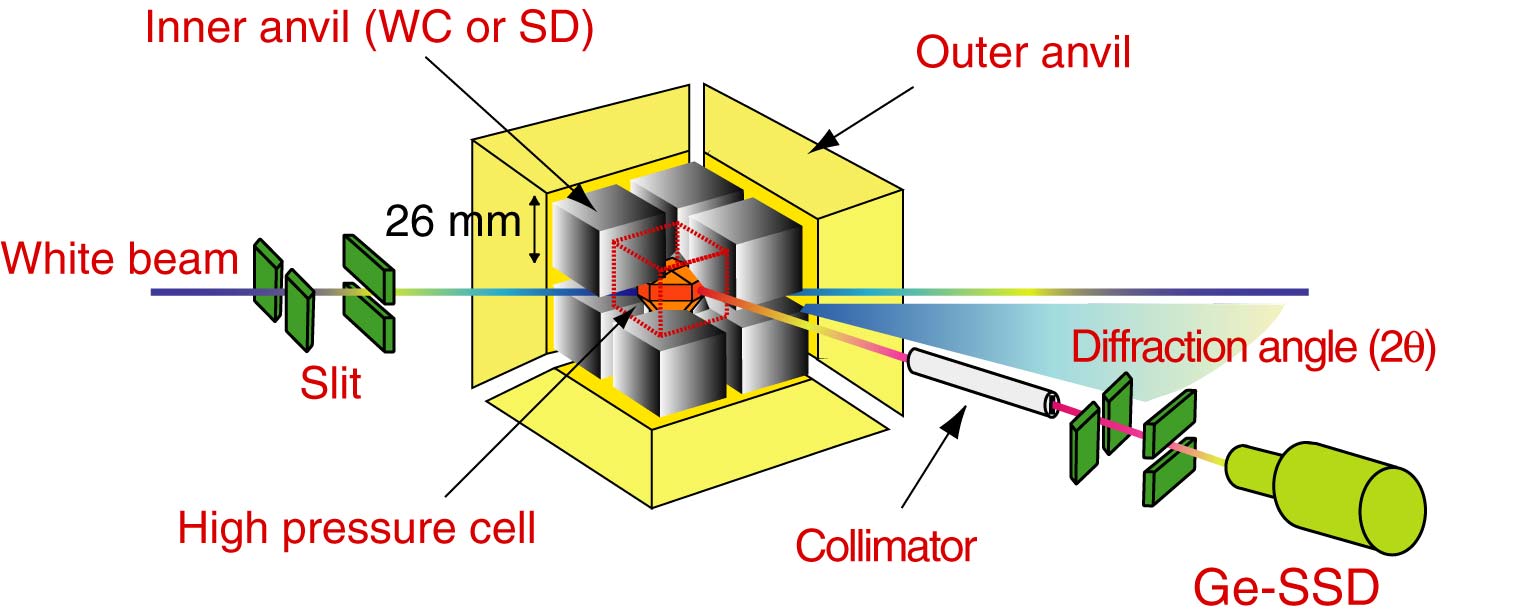
Fig. Schematic drawing of the energy-dispersive X-ray diffraction on the Kawai-type large-volume press.
Source of the figure
Beamline Report
Page
14
Required time for experimental setup
1 day(s)
Instruments
| Instrument | Purpose | Performance |
|---|---|---|
| SPEED-1500 | High pressure and high temperature experiment | 2500K, 30 GPa |
References
| Document name |
|---|
| Phys. Rev. Lett., 93, 015501(2004) |
Related experimental techniques
Questionnaire
The measurement was possible only in SPring-8. Impossible or very difficult in other facilities.
This solution is an application of a main instrument of the beamline.
Ease of measurement
Middle
Ease of analysis
With a great skill
How many shifts were needed for taking whole data in the figure?
Four-nine shifts