DNA塩基薄膜の分子面配向角度の観測

問い合わせ番号
SOL-0000001483
ビームライン
BL23SU(JAEA 重元素科学II)
学術利用キーワード
| A. 試料 | 有機材料, 原子・分子・ラジカル, 生物・医学 |
|---|---|
| B. 試料詳細 | 高分子有機材料, 分子 (中性), 生体(in vitro), 生体組織、細胞系等, 生体材料, 核酸 |
| C. 手法 | 吸収、及びその二次過程 |
| D. 手法の詳細 | XANES |
| E. 付加的測定条件 | 偏光(円、楕円), 超高真空, 室温 |
| F. エネルギー領域 | 軟X線(<2 keV) |
| G. 目的・欲しい情報 | 化学状態 |
産業利用キーワード
| 階層1 | 環境, 製薬 |
|---|---|
| 階層2 | ドラッグデザイン, 食品 |
| 階層3 | タンパク質, 薬物 |
| 階層4 | 膜厚, 配向, 化学状態 |
| 階層5 | NEXAFS |
分類
A40.40 表面・界面化学, M40.40 軟X線分光
利用事例本文
固体薄膜に対するXANES強度の入射光と薄膜表面との角度依存性の測定は基板上の分子の配向角度を調べることのできる簡便な手法です。この手法を用いることで、薄膜上の異なる元素を選択して配向角度を測定することができます。BL23SUの単色軟X線を利用して、窒素や酸素などの軽元素の内殻電子を選択して励起することが可能になります。図に示すのは、DNA構成塩基(アデニン、グアニン、ウラシル)について測定した窒素K殻領域のXANESの*強度の入射光と基板との角度変化です。この結果から、アデニン、グアニンおよびウラシルはそれぞれ基板に対して15、38および16傾いて配向していることがわかりました。一方、シトシンおよびチミンはランダムな配向を持つことがわかりました。
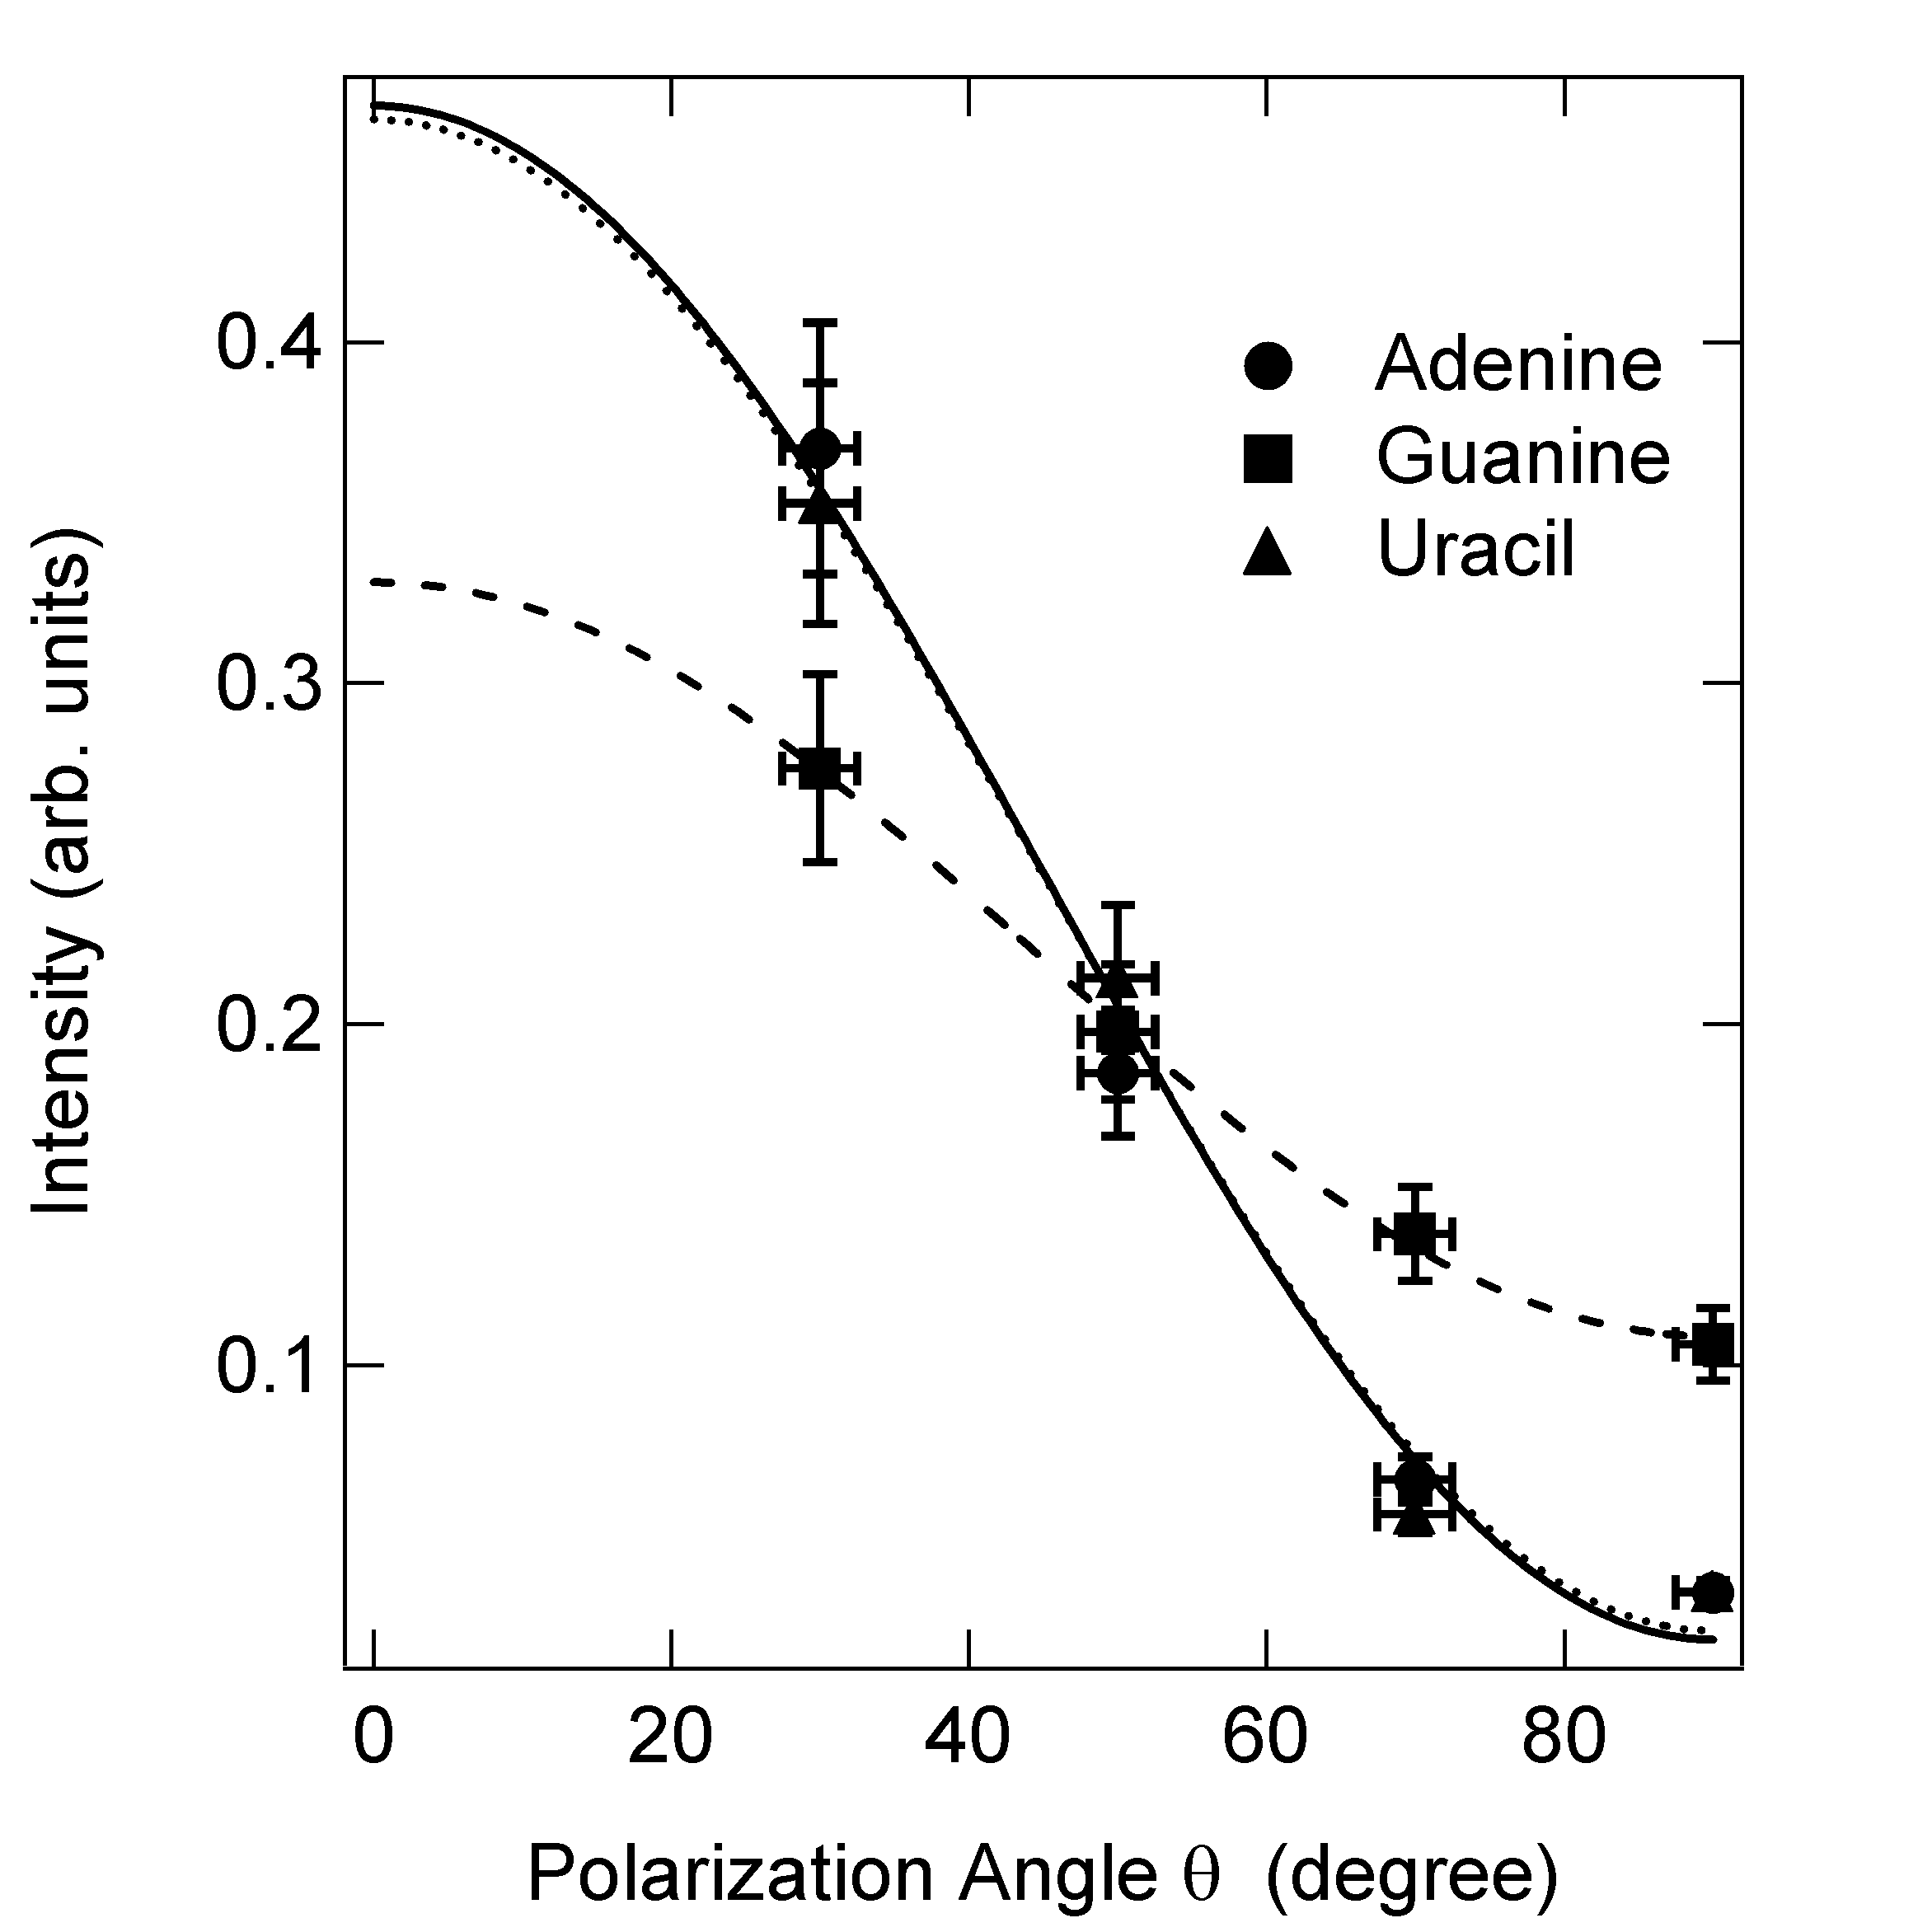
Fig. 1 Polarization dependence of the intensities of the * resonances in the N 1s NEXAFS spectra of nucleobases. The symbols (●■▲) show the normalized peak area ratios of the lowest * resonance of adenine, guanine, and uracil obtained from the curve-fitting procedure. Solid, dashed, and dotted lines show the curve-fitting results for adenine, guanine, and uracil, respectively.
[ K. Fujii, K. Akamatsu and A. Yokoya, The Journal of Physical Chemistry B 108, 8031-8035 (2004), Fig. 4,
©2004 American Chemical Society ]
画像ファイルの出典
原著論文/解説記事
誌名
The Journal of Physical Chemistry B 108 (2004) 8031-8035
図番号
4
測定手法
角度分解XANES分光法は、放射光の入射光と表面との角度を変えながらXANES測定を行うことによって得られます。この例では、DNA塩基の基板に対する配向角度がえられます。
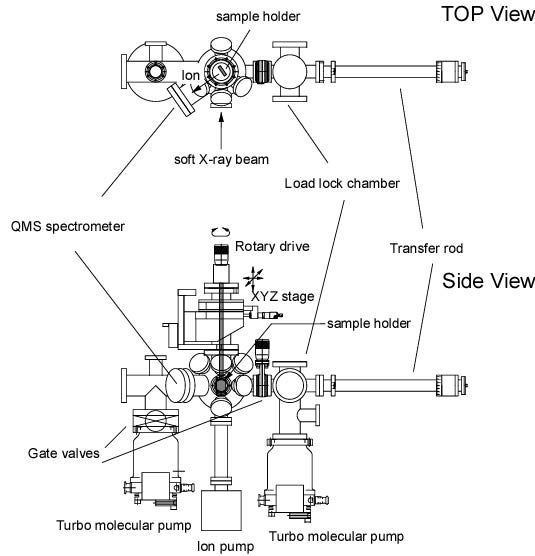
Fig. 2 Illustration of the measurement chamber for ion desorption.
The vacuum chamber is connected to the beam-line vacuum pipe.
[ K. Fujii, K. Akamatsu and A. Yokoya, Radiation Research 161, 435-441 (2004), Fig. 1,
©2004 Radiation Research Society ]
画像ファイルの出典
原著論文/解説記事
誌名
K. Fujii et. al., Radiation Research 161 (2004) 435-441
図番号
1
測定準備に必要なおおよその時間
1 時間
測定装置
| 装置名 | 目的 | 性能 |
|---|---|---|
| 生物物理学的分光装置 | 光脱離イオン観測 | 1~510amu |
参考文献
| 文献名 |
|---|
| K. Fujii et. al., The Journal of Physical Chemistry B 108 (2004) 8031-8035 |
| K. Fujii et. al., Nuclear Instruments and Methods in Physics Research B 199 (2003) 249-254 |
| 藤井健太郎、放射光 16 (2003) 17-24 |
関連する手法
アンケート
本ビームラインの主力装置を使っている
測定の難易度
初心者でもOK
データ解析の難易度
中程度
図に示した全てのデータを取るのにかかったシフト数
2~3シフト