Low-temperature white X-ray topography

Inquiry number
SOL-0000000920
Beamline
BL28B2 (White Beam X-ray Diffraction)
Scientific keywords
| A. Sample category | inorganic material |
|---|---|
| B. Sample category (detail) | semiconductor, ferroelectric material, crystal |
| C. Technique | X-ray diffraction |
| D. Technique (detail) | |
| E. Particular condition | 2D imaging, low-T (~ liquid He) |
| F. Photon energy | X-ray (> 40 keV) |
| G. Target information | structural change, phase transition |
Industrial keywords
| level 1---Application area | Semiconductor |
|---|---|
| level 2---Target | silicon semiconductor, condenser |
| level 3---Target (detail) | capacitance insulator |
| level 4---Obtainable information | crystal structure |
| level 5---Technique | imaging |
Classification
A80.12 semiconductor, A80.30 inorganic material, M10.10 single crystal diffraction
Body text
White X-ray topography is a powerful technique to study the zone boundary phase transition. Using this technique, one can measure spontaneous strain of strontium titanate in a short measuring time. Figures show white X-ray topographs of domain structure in strontium titanate. These data reveal the temperature dependence of spontaneous strain.
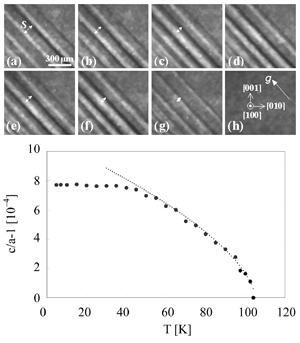
Fig. White X-ray topographs of domains and temperature dependence of spontaneous strain in the (100) plate of strontium titanate.
[ T. Ozaki, K. Kusunose, H. Sakaue, K. Kajiwara, H. Okamoto, Y. Chikaura and T. Suzuki, Nuclear Instruments and Methods in Physics Research B 238, 255-258 (2005), Fig. 2,
©2005 Elsevier Science Publisher ]
Source of the figure
Original paper/Journal article
Journal title
T. Ozaki, K. Kusunose, H. Sakaue, H. Okamoto, K. Kajiwara, Y. Suzuki and Y. Chikaura, Nuclear Instruments and Methods in Physics Research B 238 (2005) 255–258
Figure No.
2
Technique
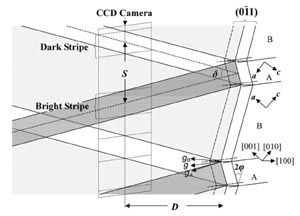
Fig.1 White X-ray topographic imaging of domain structure in strontium titanate. The hill and valley structure of the (1-10) plane splits the diffraction vector g into gA for the domain A and gB for the domain B. The overlap of the images of A and B forms the bright stripes, while the separation of the images of A and B forms the dark stripes, on the image taken with CCD camera. The stripes are parallel to the domain walls as well as g. The splitting between the bright and dark stripes S is related to the camera distance D according to the formula, S=2Dtan[sin-1(sin2φsinθB)]≈4DφsinθB.
[ T. Ozaki, K. Kusunose, H. Sakaue, K. Kajiwara, H. Okamoto, Y. Chikaura and T. Suzuki, Nuclear Instruments and Methods in Physics Research B 238, 255-258 (2005), Fig. 1,
©2005 Elsevier Science Publisher ]
Source of the figure
Original paper/Journal article
Journal title
T. Ozaki, K. Kusunose, H. Sakaue, H. Okamoto, K. Kajiwara, Y. Suzuki and Y. Chikaura, Nuclear Instruments and Methods in Physics Research B 238 (2005) 255–258
Figure No.
1
Required time for experimental setup
24 hour(s)
Instruments
| Instrument | Purpose | Performance |
|---|---|---|
| X-ray imaging camera | Imaging detecter |
References
| Document name |
|---|
| T. Ozaki, I. Fijimoto, K. Mizuno, S. Iida, K. Kajiwara, T. Taira, J. Yoshimura, T. Shimura, Y. Chikaura, Nucl. Instr. Meth. Phys. Res. B 199 (2003) 81-84 |
Related experimental techniques
Questionnaire
The measurement was possible only in SPring-8. Impossible or very difficult in other facilities.
Ease of measurement
Middle
Ease of analysis
Middle
How many shifts were needed for taking whole data in the figure?
Two-three shifts