白色X線トポグラフィによるチタン酸ストロンチウムの自発ひずみ測定

問い合わせ番号
SOL-0000001523
ビームライン
BL28B2(白色X線回折)
学術利用キーワード
| A. 試料 | 無機材料 |
|---|---|
| B. 試料詳細 | 半導体, 誘電体・強誘電体, 結晶 |
| C. 手法 | X線回折 |
| D. 手法の詳細 | |
| E. 付加的測定条件 | 二次元画像計測, 低温(〜液体ヘリウム) |
| F. エネルギー領域 | X線(>40 keV) |
| G. 目的・欲しい情報 | 構造変化, 相転移 |
産業利用キーワード
| 階層1 | 半導体 |
|---|---|
| 階層2 | シリコン系半導体, コンデンサー |
| 階層3 | 容量膜 |
| 階層4 | 結晶構造 |
| 階層5 | イメージング |
分類
A80.12 半導体・電子材料, A80.30 無機材料, M10.10 単結晶回折
利用事例本文
白色X線トポグラフィは、局所的な結晶構造の変化を短時間でイメージとして調べることのできるユニークな手法です。この手法を用いることで、誘電体単結晶の構造相転移における自発ひずみを測定することができます。図に示すのは、(a)-(d)4.8Kの温度におけるコントラストのカメラ長依存性、(e)-(h)673mmのカメラ長におけるコントラストの温度依存性を示したチタン酸ストロンチウムのトポグラフ像です。これらの結果から、チタン酸ストロンチウムの自発ひずみの温度依存性が精密にわかりました。
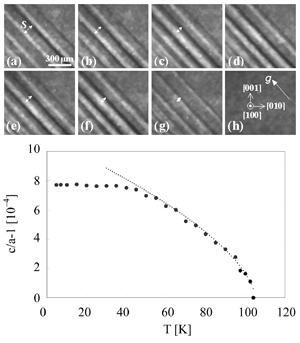
図 低温におけるチタン酸ストロンチウムのトポグラフ像と自発ひずみの温度依存性
(a) T=4.8K、D=673mm、(b) T=4.8K、D=580mm、(c) T=4.8K、D=430mm、(d) T=4.8K、D=300mm、
(e) T=60K、D=673mm、(f) T=80K、D=673mm、(g) T=100K、D=673mm、(h) T=105K、D=673mm、
[ T. Ozaki, K. Kusunose, H. Sakaue, K. Kajiwara, H. Okamoto, Y. Chikaura and T. Suzuki, Nuclear Instruments and Methods in Physics Research B 238, 255-258 (2005), Fig. 2,
©2005 Elsevier Science Publisher ]
画像ファイルの出典
原著論文/解説記事
誌名
T. Ozaki, K. Kusunose, H. Sakaue, H. Okamoto, K. Kajiwara, Y. Suzuki and Y. Chikaura, Nuclear Instruments and Methods in Physics Research B 238 (2005) 255–258
図番号
2
測定手法
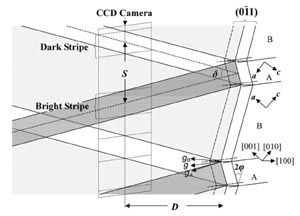
図1. 白色X線トポグラフィによる自発歪み測定の概要。隣合う分域からのトポグラフ像が重なり白黒のコントラストを生じる。自発歪みc/a-1と分域の傾き2φは、2(c/a-1)=2φの関係があり、2φと、白黒のコントラストの間隔Sおよび試料からカメラまでの距離Dには、S≈4DφsinθBの関係がある。したがって、SおよびDを測定することでc/a-1が決まる。
[ T. Ozaki, K. Kusunose, H. Sakaue, K. Kajiwara, H. Okamoto, Y. Chikaura and T. Suzuki, Nuclear Instruments and Methods in Physics Research B 238, 255-258 (2005), Fig. 1,
©2005 Elsevier Science Publisher ]
画像ファイルの出典
原著論文/解説記事
誌名
T. Ozaki, K. Kusunose, H. Sakaue, H. Okamoto, K. Kajiwara, Y. Suzuki and Y. Chikaura, Nuclear Instruments and Methods in Physics Research B 238 (2005) 255–258
図番号
1
測定準備に必要なおおよその時間
24 時間
測定装置
| 装置名 | 目的 | 性能 |
|---|---|---|
| クライオスタット | 試料温度を下げる | 3.8-300K、±0.1K |
| ビームモニタ、CCDカメラ | 検出器 | 実効ピクセルサイズ5.83 μm |
参考文献
| 文献名 |
|---|
| T. Ozaki, I. Fijimoto, K. Mizuno, S. Iida, K. Kajiwara, T. Taira, J. Yoshimura, T. Shimura, Y. Chikaura, Nucl. Instr. Meth. Phys. Res. B 199 (2003) 81-84 |
関連する手法
アンケート
SPring-8だからできた測定。他の施設では不可能もしくは難しい
測定の難易度
中程度
データ解析の難易度
中程度
図に示した全てのデータを取るのにかかったシフト数
2~3シフト