BL39XU Examples of experimental data
Inquiry number
INS-0000000284
Examples of experimental data
Figure 1 shows an example of XMCD data measured at BL39XU. An XMCD spectrum of Mn3ZnC powder sample was recorded at the Mn K-edge (6540 eV), using the helicity-modulation technique in the transmission mode. The XMCD signal is as small as 0.1% of the XANES step height. Good statistical accuracy of 0.01% was obtained in a measuring time of about one hour.
An element-specific magnetization curve is obtained by monitoring XMCD amplitude at the absorption edge of a particular element. Figure 2 shows element-specific magnetization curves of Gd (a) and Fe (b) of a [Gd(20 Å)/Fe(20 Å)]50 multilayer film. This results clearly shows that Gd and Fe magnetic moments couple antiferromagnetically. The magnetization curves of Gd and Fe are quite different from the total magnetization curve, shown by a solid line in Fig. 5(a).
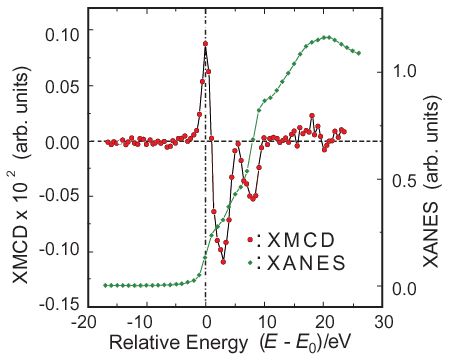
- Fig. 1. An X-ray magnetic circular dichroism (XMCD) spectrum of Mn3ZnC in the ferromagnetic phase at 300 K, measured at the Mn K-edge (E0 = 6540 eV). The XANES spectrum is compared.[1,2]
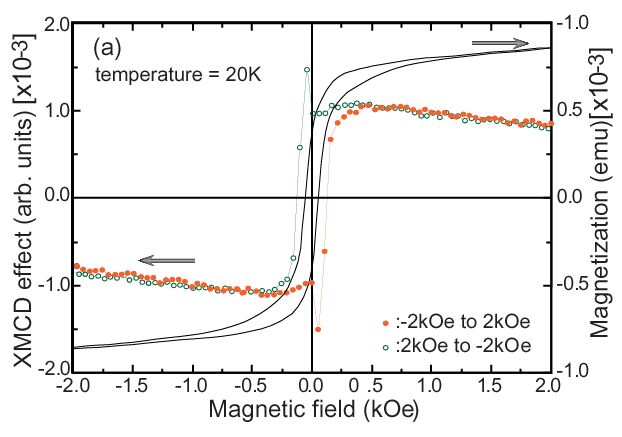
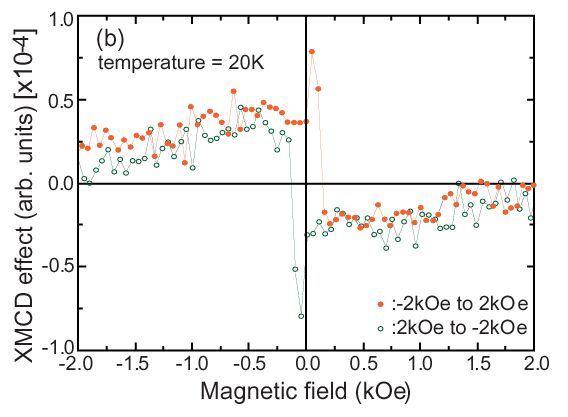
- Fig. 2. Element-specific magnetization curves of a [Gd(20 Å)/Fe(20 Å)]50 multilayer film: (a) Gd magnetization curve (dots), compared with the total magnetization curve (solid line), and (b) Fe magnetization curve (dots). [3,4]
References
- S. Uemoto, et al., J. Synchrotron Rad. 8 (2001) 449.
- N. Kawamura, et al., J. Phys. Soc. Jpn. 76 (2007) 074716.
- A. Koizumi, et al., Phys. Rev. B61 (2000) R14909.
- M. Takagaki, et al., J. Phys. Soc. Jpn. 72 (2003) 245.