Topic 5: Observation of Myocardial Contraction using X-ray Diffraction
Observation of the Changes in Myocardial Tissues of Live Animals
In advanced countries, including Japan, heart failure accounts for an increasing proportion of the cause of death. Treatment of heart failure has advanced over time; however, the prognosis of heart failure is far from satisfactory, and it continues to be a significant disease that affects the quality of life for middle-aged and senior adults, as well as the medical economy. Recent advances in diagnosis of cardiovascular diseases have been extensive, but the pathologies of many diseases, including dilated cardiomyopathy, have yet to be clarified. Under these circumstances, in 2006 researchers at SPring-8 developed new techniques to examine the mechanisms of myocardial contraction. These new methods are based on dynamic analyses of myocardial structural proteins of live animals. Such new progress is expected to help us develop new diagnostic methods for cardiovascular diseases.
Analyses of the Movement of Cardiac Muscle at the Nano Level
Reductions in cardiac contractile and relaxing/diastolic capacities are among the problematic pathological conditions of myocardial dysfunctions. Actin and myosin, which are abundant proteins in cardiac muscle, are responsible for muscle contraction, which is essential for the pumping of blood. Therefore, these proteins are intimately involved with the pathological conditions of cardiac diseases.
Cardiac muscle and skeletal muscle have a three-layer structure: muscle, muscle fiber, and myofibril. Myofibril has a systematic periodic structure that exhibits stripes in the direction of the long axis; it is also called “striated muscle.” The unit of this periodic structure is the sarcomere, which consists of the myosin filament and the actin filament (Fig. 1). The area where myosin filaments exist is called the A-band, and the area where only actin filaments exist is called I-band. When crossbridges are formed between these filaments, the myosin and actin filaments slide past each other to shorten the length of sarcomeres, causing the cardiac muscle to contract. This process provides the force for the heartbeat. The contractile force is determined by the binding force between the filaments.
A double-hexagonal lattice, which is comprised of myosin and actin filaments, is found in the cross-section of the A-bands of the sarcomeres in cardiac cells (Figs. 1 and 2a). A plane that is formed by myosin filaments is defined as a (1,0) lattice plane; a plane formed by myosin and actin filaments is defined as a (1,1) lattice plane. Both myosin and actin are protein molecules, with sizes ranging from a few nm to a few tens of nm (1 nm = 10-9 m); the size of the muscle filaments and the lattice structures are also on the order of nanometers.
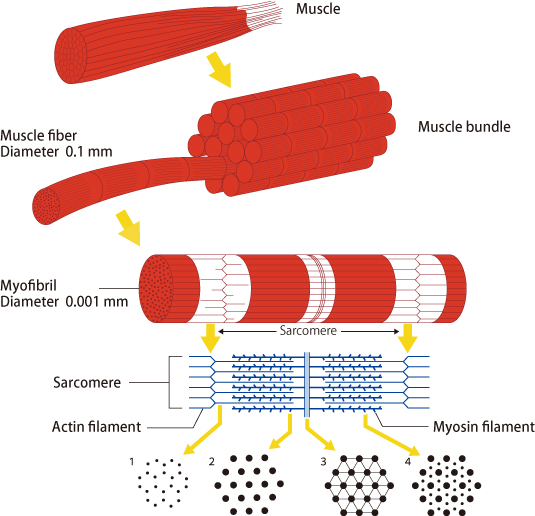
Each muscle cell contains many myofibrils and sarcomeres, which are the minimum units of muscular contraction, aligned in tandem. Filaments (microfibers), which are comprised of many actin and myosin molecules, form systematic hexagonal lattices in the sarcomeres.
Myofibril Functions that Regulate the Expansion and Contraction of Myocardial Cells
Dr. Ryuji Toh (Assistant Professor, Kobe University School of Medicine, Japan), and Dr. Masakazu Shinohara (Researcher, ditto), Dr. Mitsuhiro Yokoyama (Director, Hyogo Prefectural Awaji Hospital, Japan), Dr. Naoto Yagi (Chief Scientist, JASRI), and colleagues have been studying these fine structures and functions in order to elucidate the pathological conditions of myocardial dysfunctions.
Traditionally, conformational analyses at the nano scale have used electron microscopes. In electron microscopy, myocardial tissues are extracted and chemically fixed in order to make measurements. As a result of exposure to fixative agents, these specimens adopt different conformations than they do in vivo. In order to overcome this problem, X-ray diffraction method is applied. Diffraction is the apparent bending of electromagnetic waves (such as X-rays) by obstacles. In the case that obstacles have a periodic structure, such as crystals or muscle fibers, diffracted X-rays produce specific patterns (diffraction patterns), depending on their structures. However, in order to apply the existing observation techniques using X-ray diffraction to visualize cardiac muscle, either extraction of the heart or open-chest surgery is required. In either case, the environment in which the heart is exposed is radically different from real in vivo conditions.
To overcome this challenge, this research group attempted an analysis of myofibril functions using the High Flux Beamline BL40XU at SPring-8. X-rays available at BL40XU have high directionality (parallelism) and a hundred times higher intensity than is available at other monochromatic beamlines with which the movements of protein molecules in cardiac cells can be observed.
By irradiating the lattice structures of the sarcomeres of cardiac cells with X-rays, the hexagonal structures can be identified by diffraction. Diffraction from the (1,0) and (1,1) lattice planes are called the “(1,0) reflection” and “(1,1) reflection,” respectively (Fig. 2). Reflection comes out at a right angle to the long-axis of the muscle, which can be compared to the meridian of the Earth; this reflection is then called the “equatorial reflection.” This equatorial reflection indicates that myosin and actin filaments are systematically aligned in the sarcomeres.
Myosin and actin filaments overlap with each other along their lengths. The two types of filaments slide past each other, which induces the expansion and contraction of cardiac cells and ultimately makes the heart contract as a whole.
We can compare the filaments to a bundle of elastic cords. In this model, the gaps between elastic cords narrow when they become expanded, and gaps widen when they contract. The distance between the center of the diffraction pattern and the equatorial reflection spot represents the distance between elastic cords. That is, the expansion and contraction of cells negatively correlate with the distance between filaments. On the other hand, the ratio of the intensity of the (1,0) reflection to that of the (1,1) reflection varies with contraction. This is because the part of the mass of the myosin filament moves closer to the actin filament when the head portion of myosin molecules binds to the actin filament upon contraction. The larger the variation in the distance, the stronger the binding, indicating that a stronger muscle contraction force is produced.
“We can obtain information about the amounts of binding force produced between filaments, as well as those of dynamic expansion and contraction of cells, by using X-ray diffraction,” said Dr. Toh.
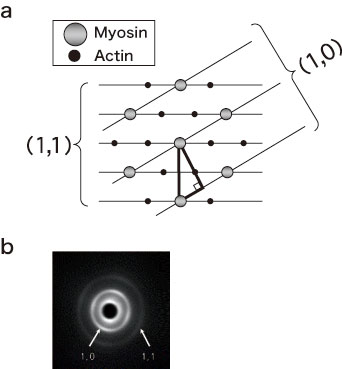
Actin and myosin filaments form the hexagonal lattice structure. Diffraction occurs when X-rays are exposed to objects that have systematic molecular configurations. The equatorial reflections images, produced from (1,0) and (1,1) lattice planes shown in (a), can be observed in the diffraction pattern of the cardiac muscle shown in (b).
Behavior of Live Muscle Tissues Unraveled
X-ray diffraction patterns are observed as expected when the mouse heart is irradiated with X-rays under anesthesia (Fig. 2b). Measurements of the (1,0) lattice spacing and the intensity ratio (1,0)/(1,1) as a function of time revealed that the (1,0) lattice spacing increased in inverse proportion to the shortening of sarcomeres during contraction. Additionally, as the head portion of myosin forms a crossbridge with actin filaments upon contraction, the mass moves to the actin filament side, resulting in increased intensity of the (1,1) reflection. This indicates that the ratio (1,0)/(1,1) decreases. On the other hand, the reverse is true for contractions, in which the (1,0) reflection surpasses the (1,1) reflection upon relaxing.
A study was conducted on the affected myocardial fibers of mice that develop symptoms similar to dilated cardiomyopathy, in which the contractile function of cardiac muscle was impaired. In this analysis, the X-ray diffraction patterns were blurred. This finding indicates that the alignment of these muscle filaments is irregular, unlike normal muscle filaments (Fig. 3). This study yielded the first ever demonstration of abnormality in muscle filaments in myocardial diseases.
“We have demonstrated that X-ray diffraction patterns obtained by using extremely brilliant and parallel X-rays can offer a highly promising diagnostic technique at the molecular level to identify abnormalities in the myocardial filaments, which could not be detected with the existing techniques,” said Dr. Toh, expressing enthusiasm for the use of X-ray diffraction at SPring-8. “We often encounter cases of heart failures, even with the normal contraction capacity of the heart. Several studies have recently suggested that the reduction in the relaxation capacity of the heart is related to the mechanisms of such heart failures, but its detailed pathophysiological conditions have yet to be elucidated. The techniques developed in our research are expected to contribute to the elucidation of the pathophysiological conditions of unexplained diseases, including dilated cardiomyopathy. Ultimately, we hope to quickly identify abnormalities that cannot be detected with the existing diagnostic techniques.”
The research achievements of this project were published in Biophysical Journal (March 2006), the journal of the Biophysics Society, and received international attention.
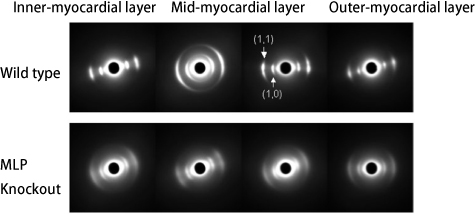
Compared with the X-ray pattern of the heart of normal mice (top), that of a myocardial disease mouse (bottom) is blurred, indicating that the alignment of muscle filaments in the latter heart is irregular.
Reference
1. R. Toh, M. Shinohara, T. Takaya, T. Yamashita, S. Masuda, S. Kawashima, M. Yokoyama and N. Yagi; Biophysical Journal, 90, 1723 (2006)