Near edge X-ray absorption fine structure of DNA nucleobases thin films in the nitrogen K-edge region

問い合わせ番号
SOL-0000000939
ビームライン
BL23SU(JAEA 重元素科学II)
学術利用キーワード
| A. 試料 | 有機材料, 原子・分子・ラジカル, 生物・医学 |
|---|---|
| B. 試料詳細 | 高分子有機材料, 分子 (中性), 生体(in vitro), 生体組織、細胞系等, 生体材料, 核酸 |
| C. 手法 | 吸収、及びその二次過程 |
| D. 手法の詳細 | XANES |
| E. 付加的測定条件 | 偏光(円、楕円), 超高真空, 室温 |
| F. エネルギー領域 | 軟X線(<2 keV) |
| G. 目的・欲しい情報 | 化学状態 |
産業利用キーワード
| 階層1 | 環境, 製薬 |
|---|---|
| 階層2 | ドラッグデザイン, 食品 |
| 階層3 | タンパク質, 薬物 |
| 階層4 | 膜厚, 配向, 化学状態 |
| 階層5 | NEXAFS |
分類
A40.40 表面・界面化学, M40.40 軟X線分光
利用事例本文
Measurement of angle dependencies of XANES intensity between incident photon and substrate for solid thin films are efficient technique to study an orientation of molecules on a substrate. Using this technique, one can measure the tilt angle of orientated molecule on a substrate by selecting an each element.
Using a high resolution monochromatic soft X-ray from BL23SU, one can selectively excite the core electron of light atom (ex. Nitrogen and Oxygen). The figure shows polarization dependencies of the intensities of * resonance in the N 1s XANES spectra of adenine, guanine and uracil. These data reveal the fact that adenine, guanine and uracil are orientated to the multilayer surface with an angle of 15, 38 and 16, although thymine and cytosine are randomly orientated with respect to the surface.
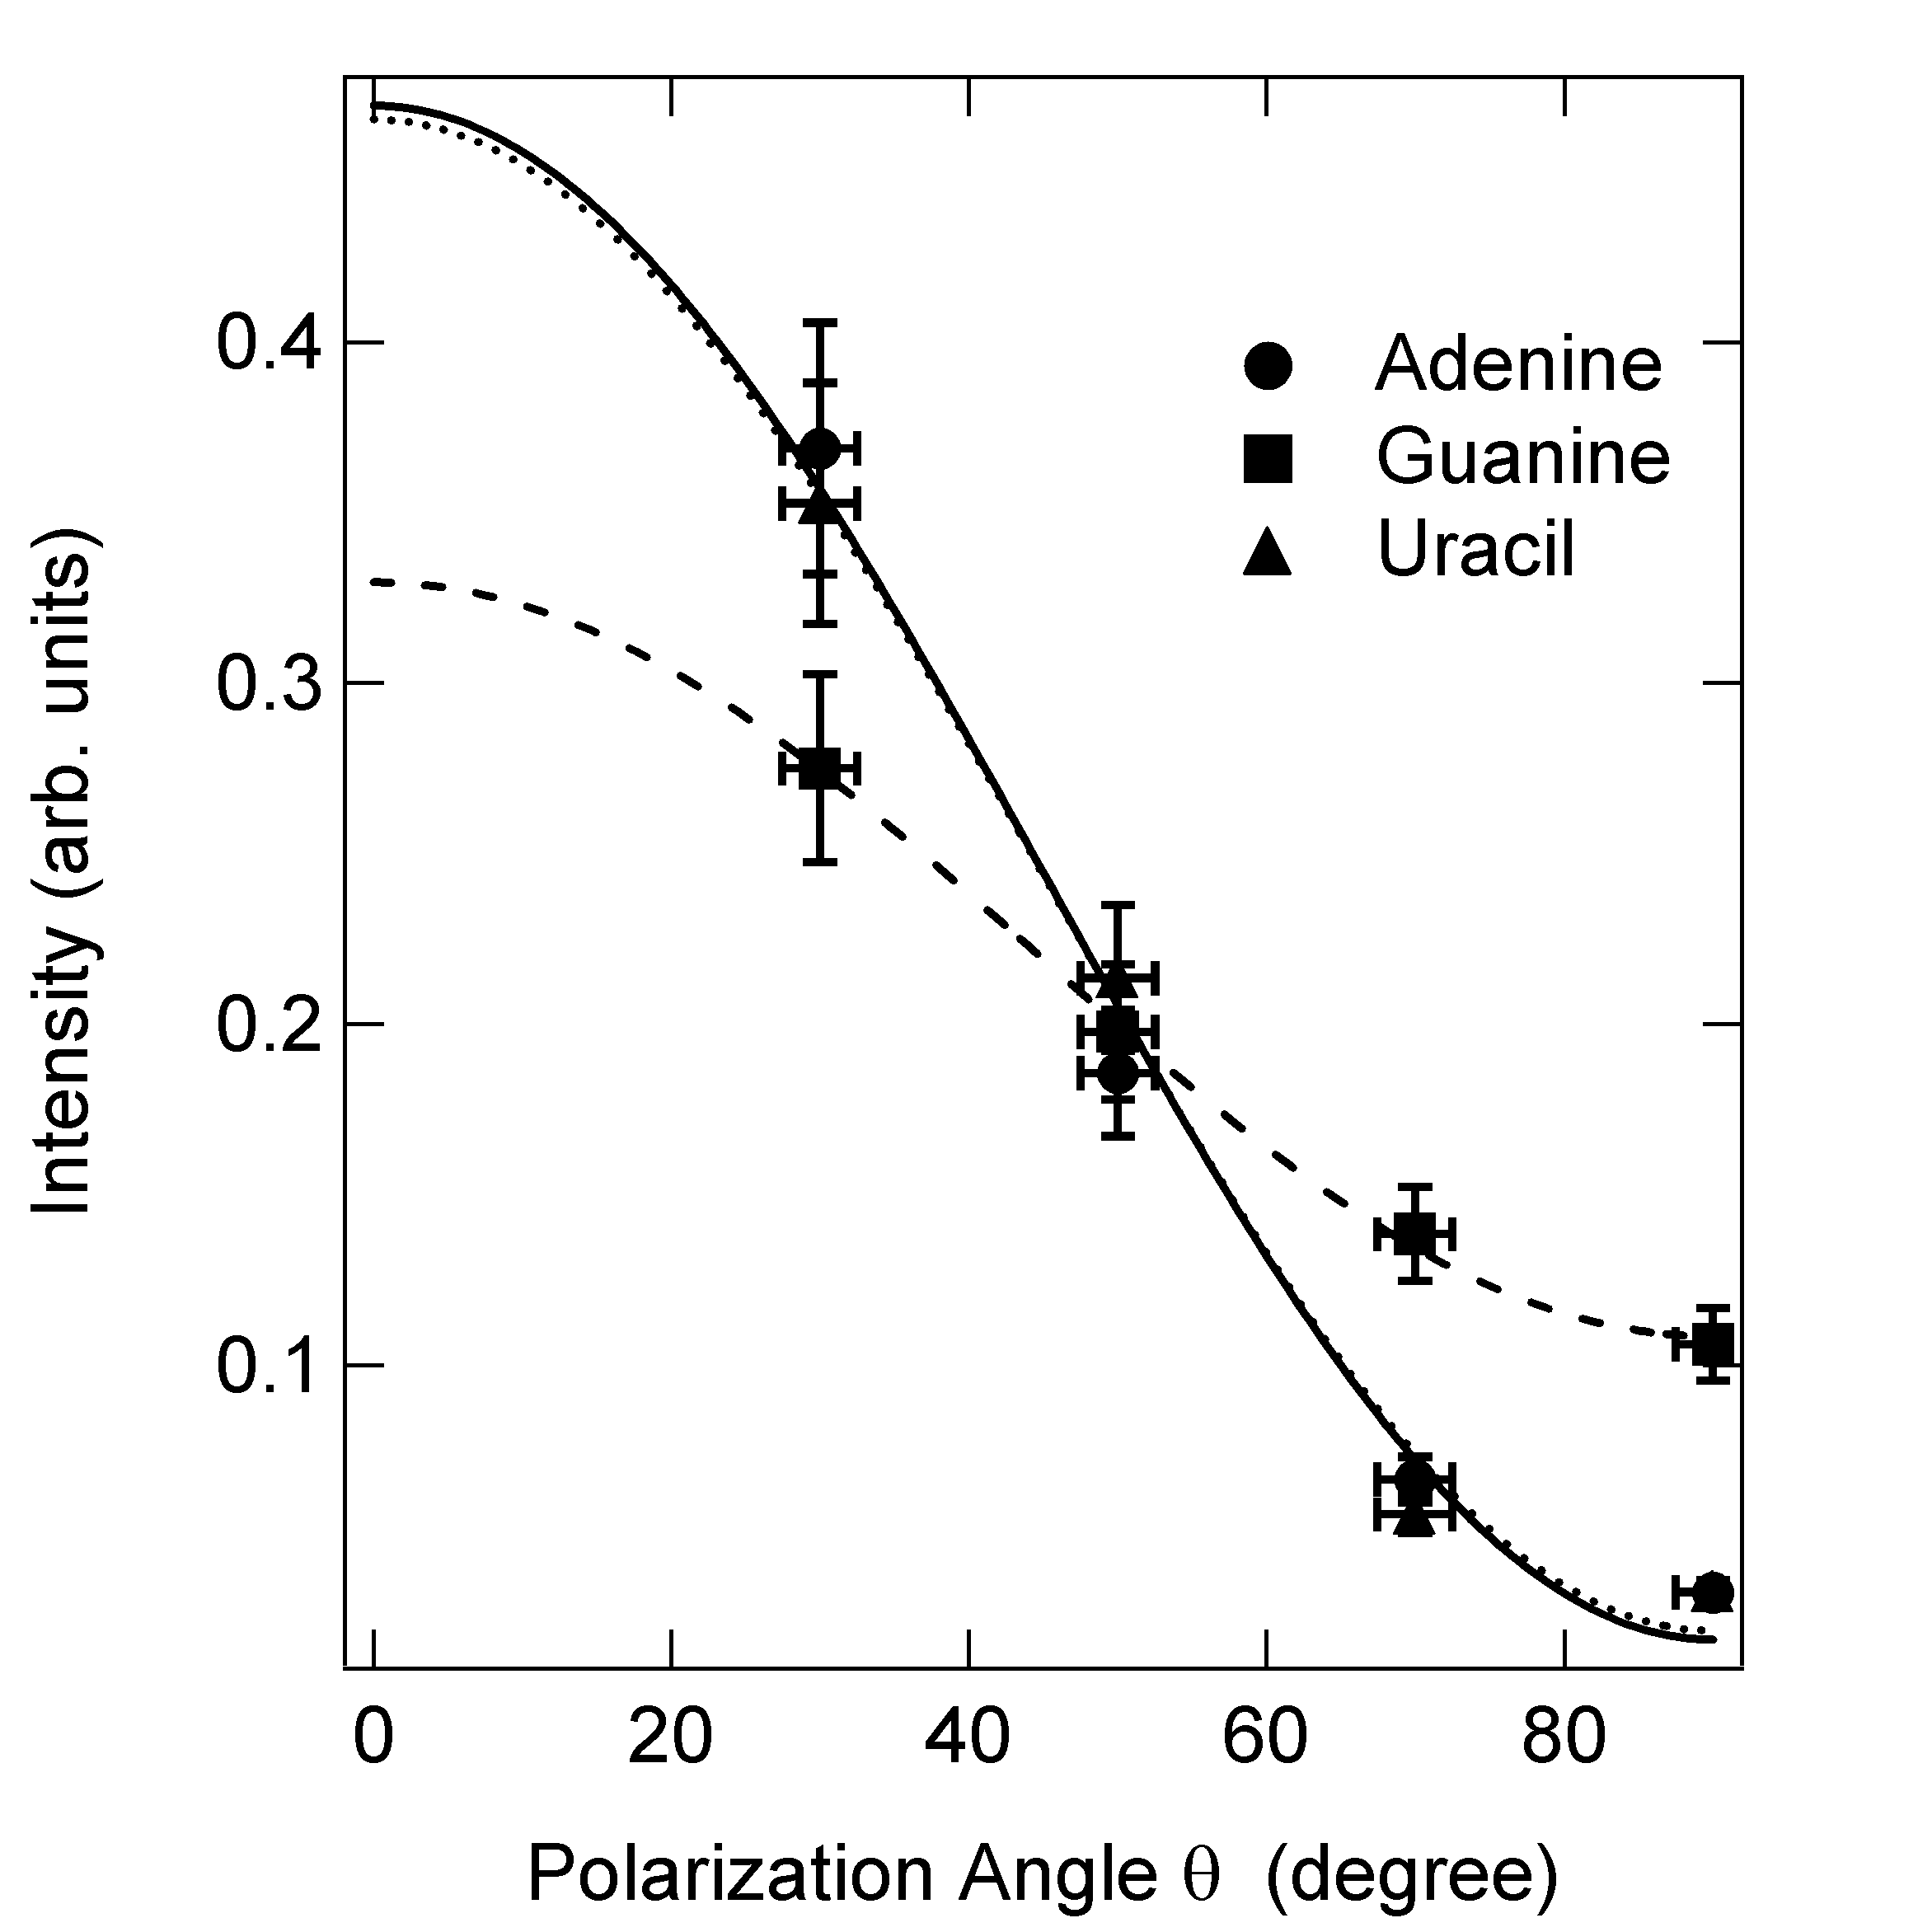
Fig. 1 Polarization dependence of the intensities of the * resonances in the N 1s NEXAFS spectra of nucleobases. The symbols (●■▲) show the normalized peak area ratios of the lowest * resonance of adenine, guanine, and uracil obtained from the curve-fitting procedure. Solid, dashed, and dotted lines show the curve-fitting results for adenine, guanine, and uracil, respectively.
[ K. Fujii, K. Akamatsu and A. Yokoya, The Journal of Physical Chemistry B 108, 8031-8035 (2004), Fig. 4,
©2004 American Chemical Society ]
画像ファイルの出典
原著論文/解説記事
誌名
The Journal of Physical Chemistry B 108 (2004) 8031-8035
図番号
4
測定手法
Angle resolved XANES measurement is performed by measure the XANES spectra by changing the angle between incident photon and substrate. In this example, tilt angle of DNA molecule to the substrate were obtained.
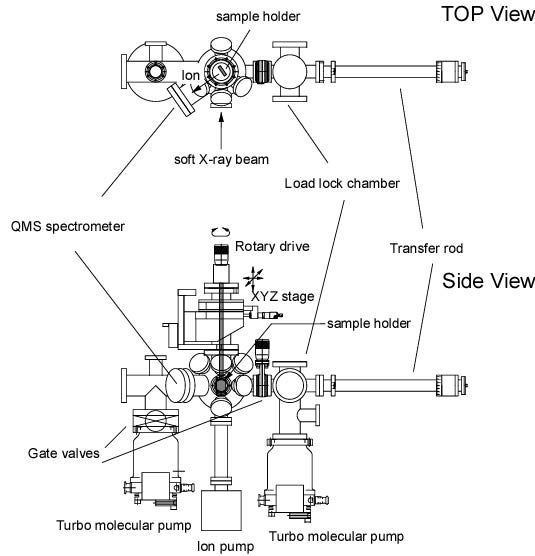
Fig. 2 Illustration of the measurement chamber for ion desorption.
The vacuum chamber is connected to the beam-line vacuum pipe
[ K. Fujii, K. Akamatsu and A. Yokoya, Radiation Research 161, 435-441 (2004), Fig. 1,
©2004 Radiation Research Society ]
画像ファイルの出典
原著論文/解説記事
誌名
K. Fujii et. al., Radiation Research 161 (2004) 435-441
図番号
1
測定準備に必要なおおよその時間
1 時間
測定装置
| 装置名 | 目的 | 性能 |
|---|---|---|
| Biophysical spectroscopy | Photon Stimulated Ion Desorption | 1-510 amu |
参考文献
| 文献名 |
|---|
| K. Fujii et. al., The Journal of Physical Chemistry B 108 (2004) 8031-8035 |
| K. Fujii et. al., Nuclear Instruments and Methods in Physics Research B 199 (2003) 249-254 |
| 藤井健太郎、放射光 16 (2003) 17-24 |
関連する手法
アンケート
本ビームラインの主力装置を使っている
測定の難易度
初心者でもOK
データ解析の難易度
中程度
図に示した全てのデータを取るのにかかったシフト数
2~3シフト