Near edge X-ray absorption fine structure of DNA nucleobases thin films in the nitrogen K-edge region

Inquiry number
SOL-0000000939
Beamline
BL23SU (JAEA Actinide Science II)
Scientific keywords
| A. Sample category | organic material, atom, molecule, radical, biology, medicine |
|---|---|
| B. Sample category (detail) | macromolecule, neutral molecule, biology (in vitro), organism, cell, biological material, nucleic acid |
| C. Technique | absorption and its secondary process |
| D. Technique (detail) | XANES |
| E. Particular condition | polarization (circular), ultra-high vacuum, room temperature |
| F. Photon energy | soft X-ray |
| G. Target information | chemical state |
Industrial keywords
| level 1---Application area | environment, Pharmaceuticals |
|---|---|
| level 2---Target | drug design, food |
| level 3---Target (detail) | protein, drug |
| level 4---Obtainable information | film thickness, orientation (preferred orientation), chemical state |
| level 5---Technique | NEXAFS |
Classification
A40.40 surface・interface chemistry, M40.40 soft x-ray spectroscopy
Body text
Measurement of angle dependencies of XANES intensity between incident photon and substrate for solid thin films are efficient technique to study an orientation of molecules on a substrate. Using this technique, one can measure the tilt angle of orientated molecule on a substrate by selecting an each element.
Using a high resolution monochromatic soft X-ray from BL23SU, one can selectively excite the core electron of light atom (ex. Nitrogen and Oxygen). The figure shows polarization dependencies of the intensities of * resonance in the N 1s XANES spectra of adenine, guanine and uracil. These data reveal the fact that adenine, guanine and uracil are orientated to the multilayer surface with an angle of 15, 38 and 16, although thymine and cytosine are randomly orientated with respect to the surface.
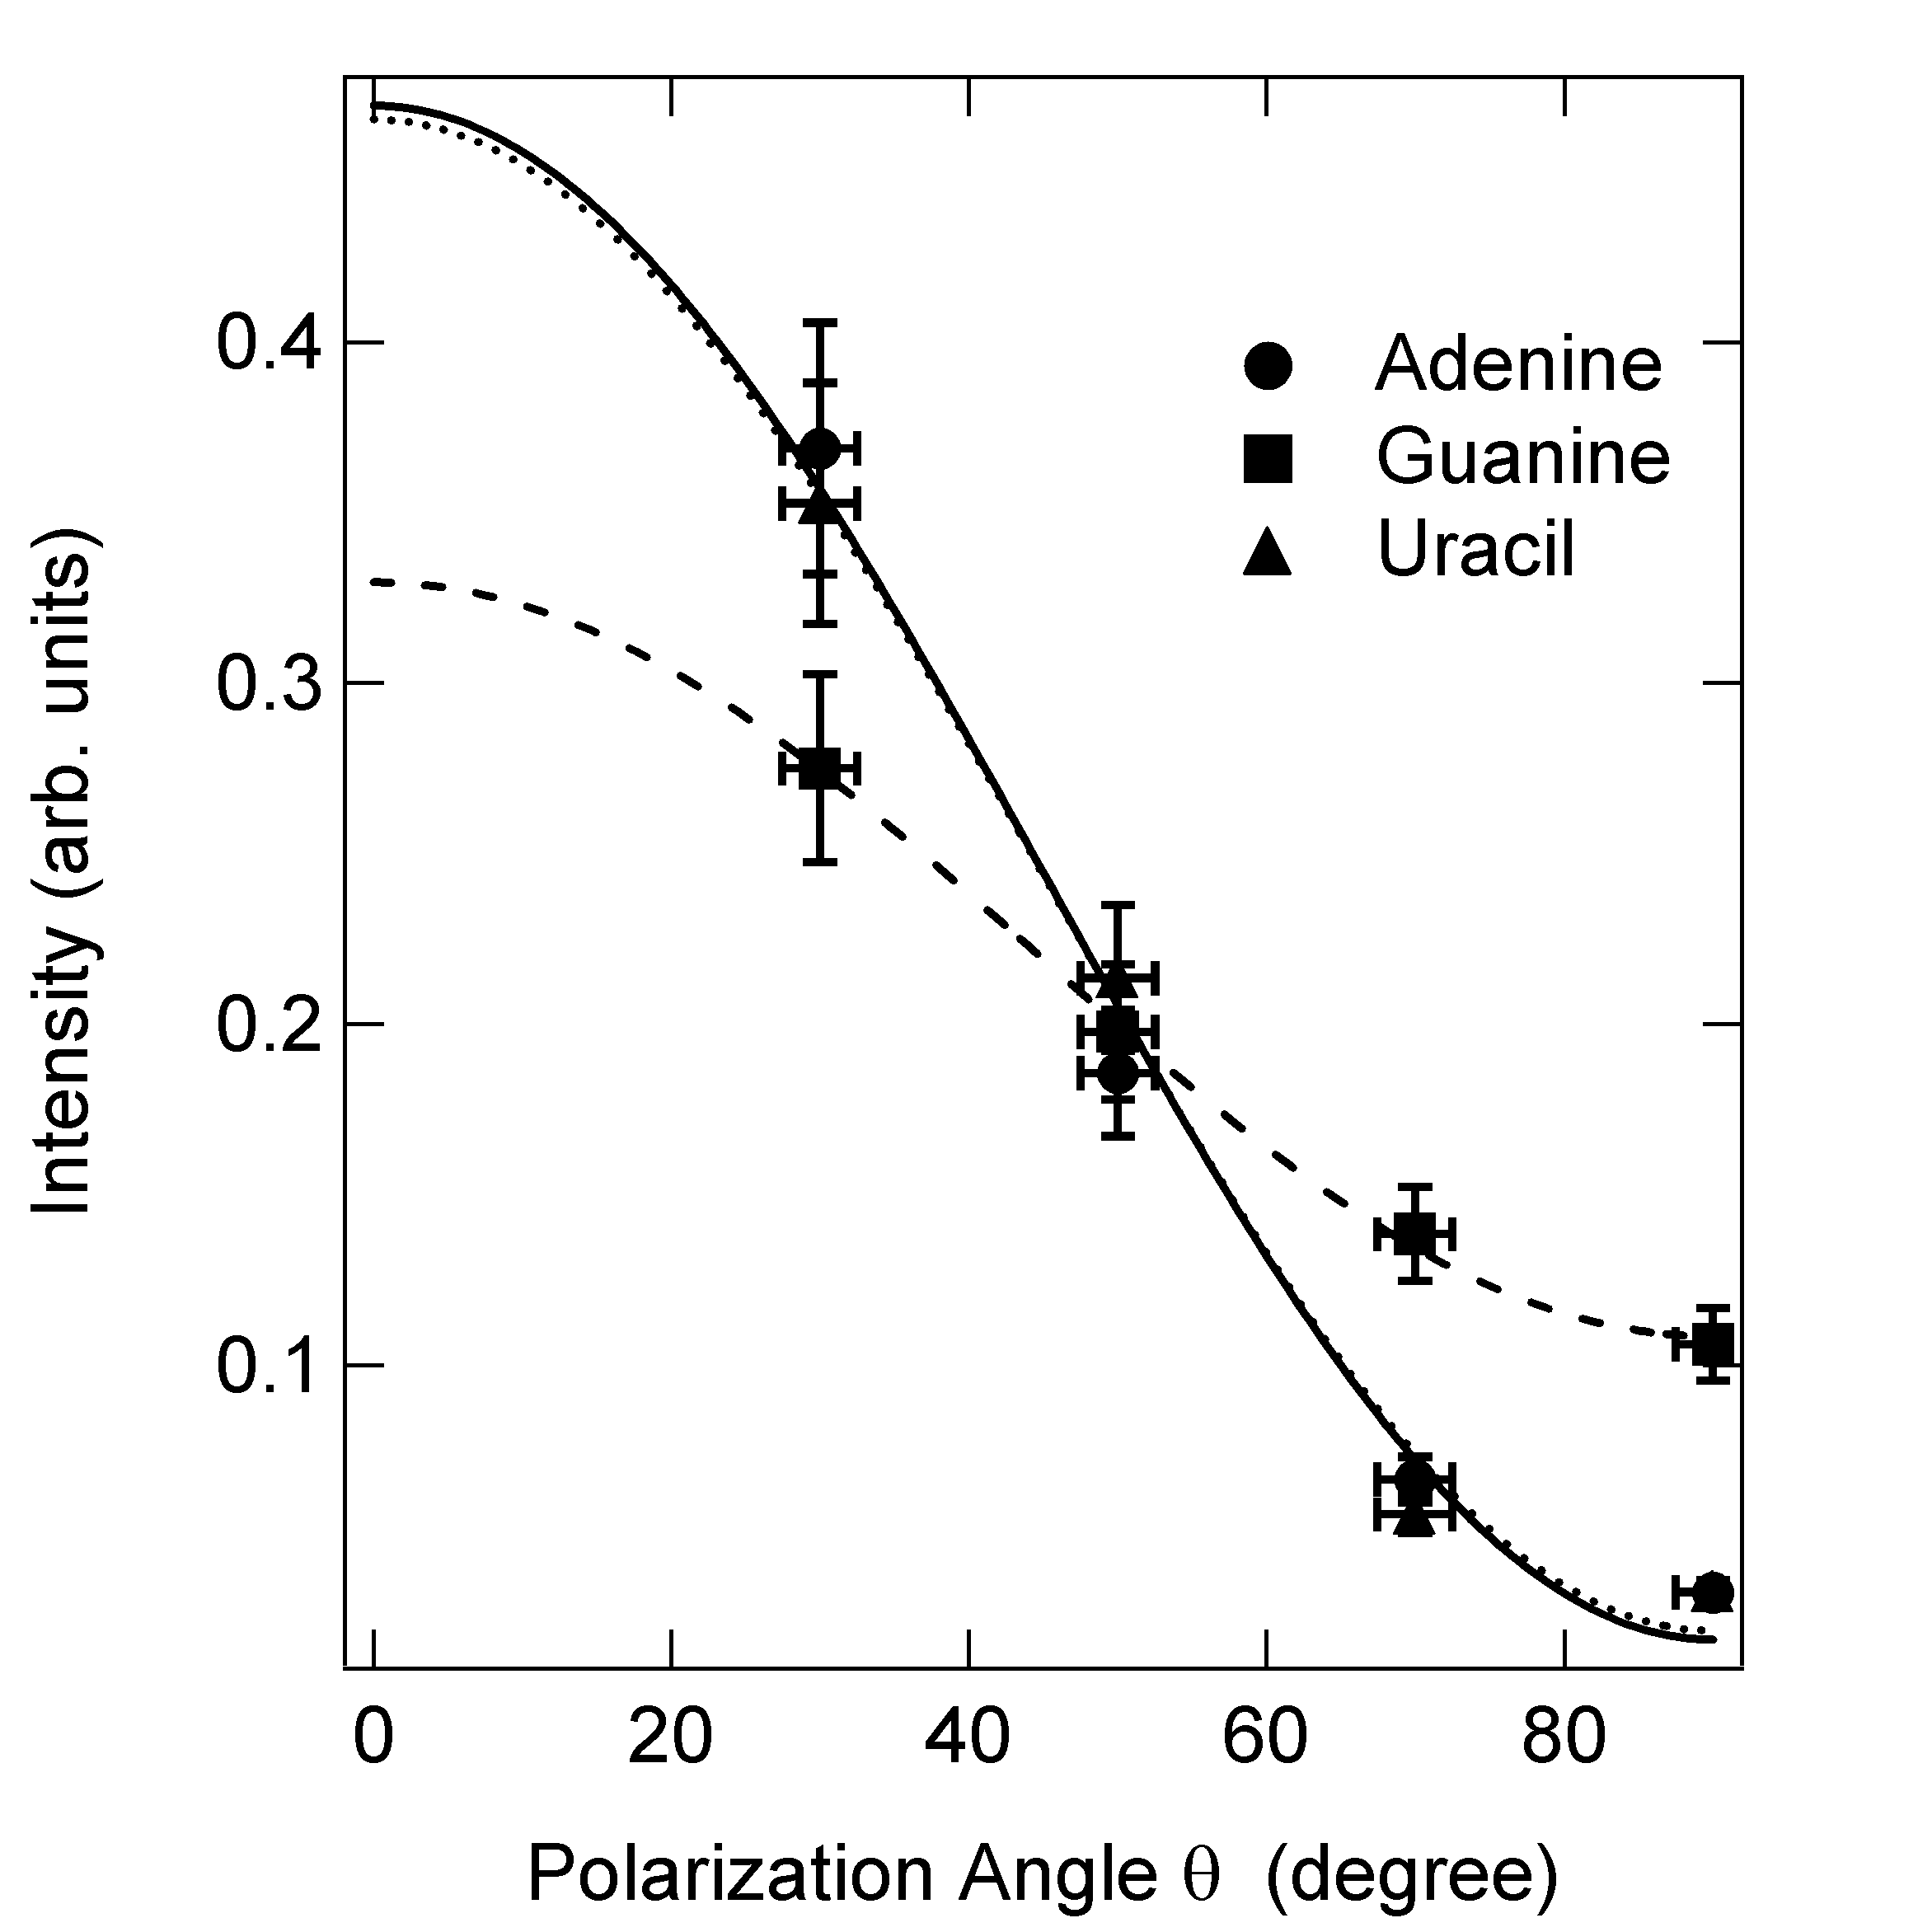
Fig. 1 Polarization dependence of the intensities of the * resonances in the N 1s NEXAFS spectra of nucleobases. The symbols (●■▲) show the normalized peak area ratios of the lowest * resonance of adenine, guanine, and uracil obtained from the curve-fitting procedure. Solid, dashed, and dotted lines show the curve-fitting results for adenine, guanine, and uracil, respectively.
[ K. Fujii, K. Akamatsu and A. Yokoya, The Journal of Physical Chemistry B 108, 8031-8035 (2004), Fig. 4,
©2004 American Chemical Society ]
Source of the figure
Original paper/Journal article
Journal title
The Journal of Physical Chemistry B 108 (2004) 8031-8035
Figure No.
4
Technique
Angle resolved XANES measurement is performed by measure the XANES spectra by changing the angle between incident photon and substrate. In this example, tilt angle of DNA molecule to the substrate were obtained.
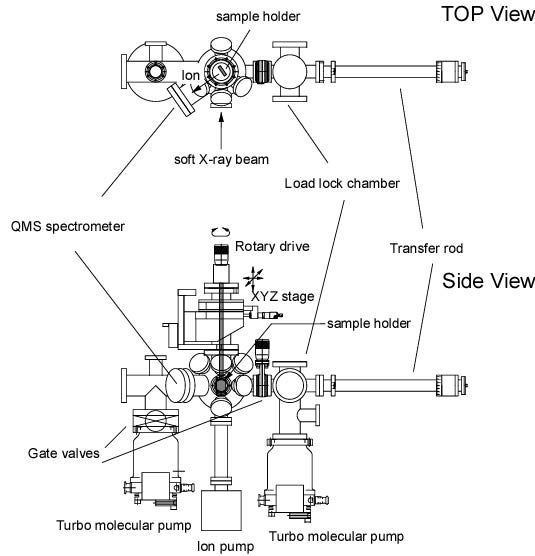
Fig. 2 Illustration of the measurement chamber for ion desorption.
The vacuum chamber is connected to the beam-line vacuum pipe
[ K. Fujii, K. Akamatsu and A. Yokoya, Radiation Research 161, 435-441 (2004), Fig. 1,
©2004 Radiation Research Society ]
Source of the figure
Original paper/Journal article
Journal title
K. Fujii et. al., Radiation Research 161 (2004) 435-441
Figure No.
1
Required time for experimental setup
1 hour(s)
Instruments
| Instrument | Purpose | Performance |
|---|---|---|
| Biophysical spectroscopy | Photon Stimulated Ion Desorption | 1-510 amu |
References
| Document name |
|---|
| K. Fujii et. al., The Journal of Physical Chemistry B 108 (2004) 8031-8035 |
| K. Fujii et. al., Nuclear Instruments and Methods in Physics Research B 199 (2003) 249-254 |
| 藤井健太郎、放射光 16 (2003) 17-24 |
Related experimental techniques
Questionnaire
This solution is an application of a main instrument of the beamline.
Ease of measurement
Easy
Ease of analysis
Middle
How many shifts were needed for taking whole data in the figure?
Two-three shifts