白色X線を用いたウィークビームトポグラフィによる微小欠陥観察手法の開発
問い合わせ番号
SOL-0000001525
ビームライン
BL28B2(白色X線回折)
学術利用キーワード
| A. 試料 | 無機材料, 計測法、装置に関する研究 |
|---|---|
| B. 試料詳細 | 半導体, 結晶 |
| C. 手法 | X線回折 |
| D. 手法の詳細 | |
| E. 付加的測定条件 | 二次元画像計測 |
| F. エネルギー領域 | X線(4~40 keV) |
| G. 目的・欲しい情報 | 欠陥、転位、歪み |
産業利用キーワード
| 階層1 | 半導体 |
|---|---|
| 階層2 | シリコン系半導体 |
| 階層3 | SOI,基板 |
| 階層4 | 格子定数 |
| 階層5 | イメージング |
分類
A80.12 半導体・電子材料, M10.10 単結晶回折
利用事例本文
白色X線トポグラフィは、簡便に単結晶中のひずみをイメージとして調べることができるユニークな手法です。試料内でのX線の干渉を利用することで、従来の手法では観察できない微小な欠陥を観察することができます。図に示すのは、FZ法で作製されたシリコン単結晶中のA欠陥の分布を示したトポグラフ像です。このように、従来の手法では観察できない微小な欠陥を比較的簡単に観察することができるようになりました。
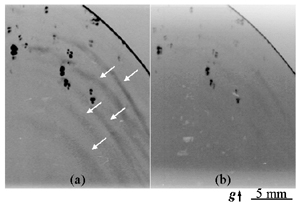
図 FZシリコンのトポグラフ像.(a)新しい手法および(b)従来の手法によるトポグラフ像
[ K. Kajiwara, S. Kimura and Y. Chikaura, Japanese Journal of Applied Physics 44, 4211-4212 (2005), Fig. 4,
©2005 日本応用物理学会 ]
画像ファイルの出典
原著論文/解説記事
誌名
Kentaro Kajiwara, Shigeru Kimura and Yoshinori Chikaura Japanese Journal of Applied Physics Vol.44, No.6A, 2005, pp.4211-4212
図番号
4
測定手法
図1に示すように、完全性の高い結晶中ではX線が動力学的な回折を起こし、干渉し強度分布を生じる。入射X線のエネルギー、回折面および試料の厚さを適当に選択し、試料の厚さTが消衰距離lLの1.6倍程度になるようにすることで、図2に示すように動力学的な回折はマージン部分以外で抑制させる。これにより微小な欠陥からの微弱な運動学的回折を検出することが可能になる。図3は実験レイアウトである。マージン部分の動力学的回折はスリットで遮断し、試料および検出器を走査することで、広い視野で運動学的回折像を得た。
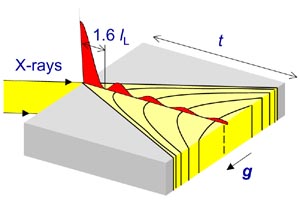
図1. ボルマンファン内に発生するペンデル縞の強度分布。ボルマンファン内の実線で示す部分は回折強度のピークを示す。
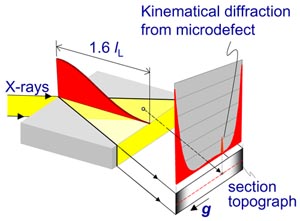
図2. 試料厚さT=1.6lLのときのペンデル縞の強度分布とセクショントポグラフィ。
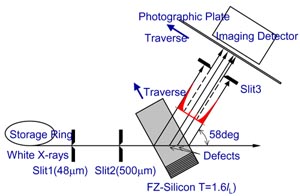
図3. 実験レイアウト。
画像ファイルの出典
私信等、その他
詳細
XTOP2004ポスターP34
測定準備に必要なおおよその時間
8 時間
測定装置
| 装置名 | 目的 | 性能 |
|---|---|---|
| イメージングプレート | 二次元検出器 | 0.05mm読取 |
参考文献
関連する手法
Kinematical Image Technique
アンケート
測定の難易度
中程度
データ解析の難易度
中程度
図に示した全てのデータを取るのにかかったシフト数
2~3シフト