New topographic method of detecting microdefects using weak-beam topography with white X-rays
Inquiry number
SOL-0000001011
Beamline
BL28B2 (White Beam X-ray Diffraction)
Scientific keywords
| A. Sample category | inorganic material, research on method, instrumentation |
|---|---|
| B. Sample category (detail) | semiconductor, crystal |
| C. Technique | X-ray diffraction |
| D. Technique (detail) | |
| E. Particular condition | 2D imaging |
| F. Photon energy | X-ray (4-40 keV) |
| G. Target information | dislocation, strain |
Industrial keywords
| level 1---Application area | Semiconductor |
|---|---|
| level 2---Target | silicon semiconductor |
| level 3---Target (detail) | SOI, substrate |
| level 4---Obtainable information | d-spacing (lattice parameter) |
| level 5---Technique | imaging |
Classification
A80.12 semiconductor, M10.10 single crystal diffraction
Body text
X-ray topography is one of powerful methods for the direct observation of lattice defects in nearly perfect crystals. By the weak-beam method, faint kinematical images of microdefects are observed with minimized dynamical background intensity using the interference effects of x-rays in a sample crystal. Figure shows the capability of the method by observing A-swirl defects in floating-zone (FZ) silicon. The dynamical background intensity is markedly reduced, and weak kinematical images could be observed.
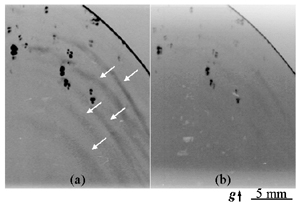
Fig. Topographs of FZ-Silicon (a) without and (b) with dynamical diffraction.
(b) shows a conventional topograph. Arrows indicate the kinematical images.
[ K. Kajiwara, S. Kimura and Y. Chikaura, Japanese Journal of Applied Physics 44, 4211-4212 (2005), Fig. 4,
©2005 The Japan Society of Applied Physics ]
Source of the figure
Original paper/Journal article
Journal title
Kentaro Kajiwara, Shigeru Kimura and Yoshinori Chikaura Japanese Journal of Applied Physics Vol.44, No.6A, 2005, pp.4211-4212
Figure No.
4
Technique
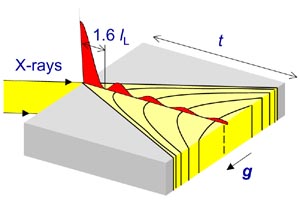
Fig.1 Intensity distribution of Pendellösung fringe arising in Borrmann fan.
The solid lines show the peak of intensity.
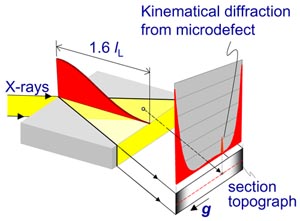
Fig.2 Intensity distribution and section topograph under the condition of T = 1.6lL .
The dynamical diffraction is suppressed except for the marginal region.
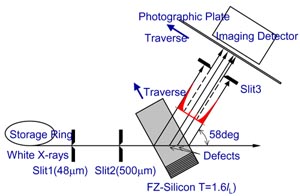
Fig.3 The experimental arrangement of the weak beam topography
with white X-rays in Laue geometry (side view).
Source of the figure
Private communication/others
Description
XTOP2004ポスターP34
Required time for experimental setup
8 hour(s)
Instruments
| Instrument | Purpose | Performance |
|---|---|---|
| Imaging Plate | Imaging detecter |
References
Related experimental techniques
Questionnaire
Ease of measurement
Middle
Ease of analysis
Middle
How many shifts were needed for taking whole data in the figure?
Two-three shifts