High energy MAD experiment using I and Xe

Inquiry number
SOL-0000001068
Beamline
BL41XU (Macromolecular Crystallography I)
Scientific keywords
| A. Sample category | biology, medicine, research on method, instrumentation |
|---|---|
| B. Sample category (detail) | crystal, biomolecule, crystal, protein, pharmaceuticals |
| C. Technique | X-ray diffraction, absorption and its secondary process, fluorescent X-rays |
| D. Technique (detail) | single crystal, MAD, XAFS |
| E. Particular condition | low-T (~ liquid N2) |
| F. Photon energy | X-ray (4-40 keV) |
| G. Target information | molecular structure |
Industrial keywords
| level 1---Application area | Pharmaceuticals |
|---|---|
| level 2---Target | drug design, process analytical technology (PAT) |
| level 3---Target (detail) | protein, drug |
| level 4---Obtainable information | supra-molecular assemblies, absolute configuration |
| level 5---Technique | XAFS, diffraction |
Classification
A80.50 Pharmaceuticals, M10.10 single crystal diffraction, M40.10 XAFS
Body text
Multiwavelength anomalous diffraction (MAD) method is the powerful method to obtain the phase information from one sample crystal composed of molecule with heavy atoms.
In this case, the MAD experiments at near energies of iodine K-absorption (33.17 keV) and xenon K-absorption (34.56 keV) were done using third harmonics of undulator on BL41XU.
Sample crystals were prepared from hen egg white lysozyme. Iodine-doped crystals were obtained by co-crystallization with sodium iodide, and xenon-doped crystals were made by putting its under high-pressure (3 MPa.) xenon gas for 15 minutes.
Precise energies of absorption edge of both iodide and xenon were decided by measurement of X-ray absorption spectra from each derivative crystal (Fig. 1). The MAD experiments were done at near energies decided absorption edge, and the phase information of the lysozyme crystal were able to determined from those successfully. Figure 2 shows the positions of iodine and xenon bound to lysozyme molecule.
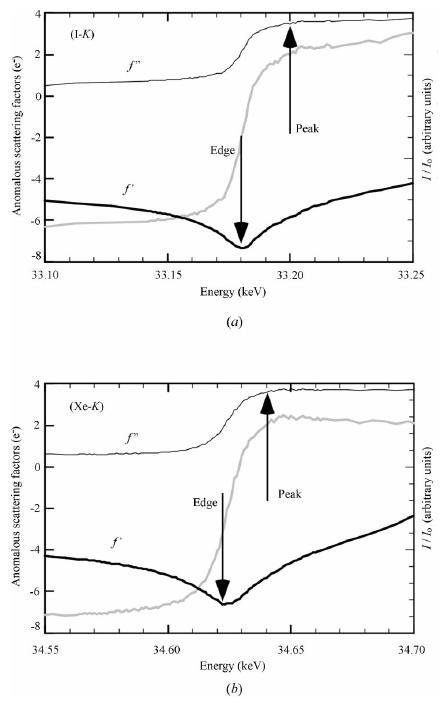
Figure 1. X-ray absorption spectra from (a) iodine and (b) xenon
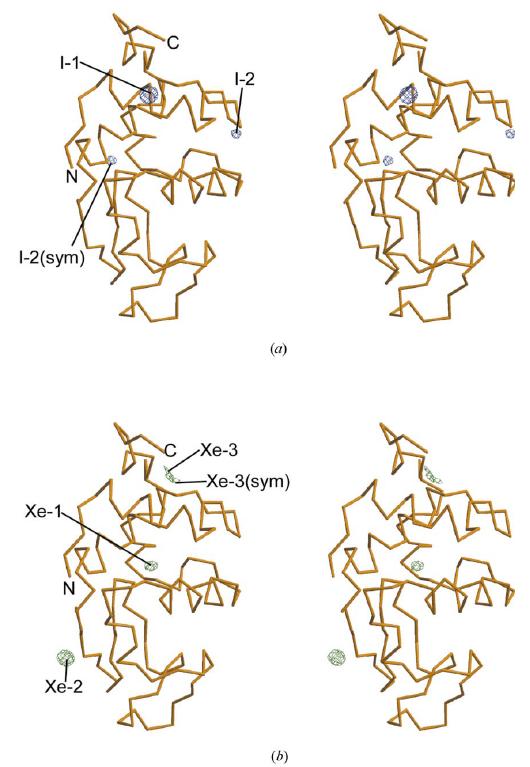
Figure 2. Bounding positions of (a) iodine and (b) xenon
[ K. Takeda, H. Miyatake, S.-Y. Park, M. Kawamoto, N. Kamiya, K. Miki, Journal of Applied Crystallography 37, 925-933 (2004), Fig. 2, 5,
©2004 International Union of Crystallography ]
Source of the figure
Original paper/Journal article
Journal title
K. Takeda, et al, J. Appl. Crystallogr. 37, 925-933 (2004)
Figure No.
2, 5
Technique
Multiwavelength anomalous dispersion (MAD) method is that the X-ray diffraction data are collected at near several energies of the absorption edge of heavy atom binding to molecule consisting crystal. By comparing and analyzing those diffraction data, the phase information is decided, and three-dimensional structure is able to determined.
Source of the figure
No figure
Required time for experimental setup
1 hour(s)
Instruments
| Instrument | Purpose | Performance |
|---|---|---|
| Protein Crystal Diffractometer | To record diffraction data | |
| Peltier-cooled Si-PIN photodiode | To measure X-ray absorption spectrum |
References
| Document name |
|---|
| K. Takeda, et al. J. Appl. Crystallogr. 37, 925-933 (2004) |
Related experimental techniques
Questionnaire
The measurement was possible only in SPring-8. Impossible or very difficult in other facilities.
This solution is an application of a main instrument of the beamline.
Ease of measurement
With a great skill
Ease of analysis
Middle
How many shifts were needed for taking whole data in the figure?
Two-three shifts