Scanning x-ray microscope

Inquiry number
SOL-0000000936
Beamline
BL47XU (Micro-CT)
Scientific keywords
| A. Sample category | inorganic material, organic material, biology, medicine, research on method, instrumentation |
|---|---|
| B. Sample category (detail) | metal, alloy, semiconductor, insulator, ceramics, amorphous, glass, biology (in vivo), biology (in vitro), organism, cell, biological material, biomolecule, noncrystal, pharmaceuticals, environmental material, food material |
| C. Technique | X-ray diffraction, X-ray elastic scattering, absorption and its secondary process, fluorescent X-rays |
| D. Technique (detail) | small angle scattering, coherent scattering, phase measurement, reflection, refraction, trace-element |
| E. Particular condition | microbeam (sub-µm), 2D imaging, 3D imaging (cf. CT), X-ray microscopy |
| F. Photon energy | X-ray (4-40 keV) |
| G. Target information | dislocation, strain, morphology, trace element |
Industrial keywords
| level 1---Application area | Semiconductor, electric component, storage device, mechanics, construction, environment, Pharmaceuticals |
|---|---|
| level 2---Target | silicon semiconductor, compound semiconductor, CD-R、DVD, process analytical technology (PAT), fiber, food, health care(shampoo, cosmetics,dental paste) |
| level 3---Target (detail) | gate insulator, electric rod, drug |
| level 4---Obtainable information | density, surface,interface, crack, crevice, structure |
| level 5---Technique | imaging |
Classification
A80.90 others
Body text
Scanning x-ray microscopy is an accurate technique to study two-dimensional imaging of inner structure of sample with high spatial resolution. Using this technique, one can measure transmission image and elemental mapping with x-ray fluorescence (XRF) of various types of samples. And edge-enhanced imaging called as dark-field method which enables a high contrast imaging for low-Z materials is also available. Spatial resolution is 0.15 - 0.5 micron.
Figure 1 shows distributions of metal inclusions in an synthesized diamond. Each image corresponds to transmission image (top-left), dark-field image (bottom-left) and XRF images of Fe, Ni, Co, and Cu (center and right). These XRF images reveal that the distribution of each element is slightly different. Figure 2 shows images of a fossil of diatom. Left and right correspond to transmission (bright field) image and dark-field image, respectively. Inner structures of the sample is resolved very clearly in the dark-field image, while it is hardly observed in the transmission image due to poor contrast.
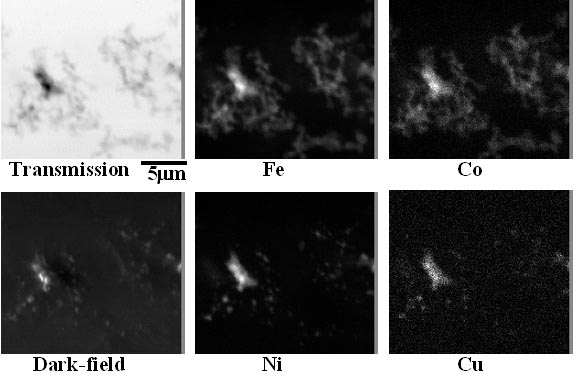
Figure 1: Distributions of metal inclusions in a synthesized diamond. Top-left: transmission image, bottom-left: dark-field image, top-center: XRF image of Fe, bottom-center: XRF image of Ni, top-right: XRF image of Ni, and bottom-right: XRF image of Cu.
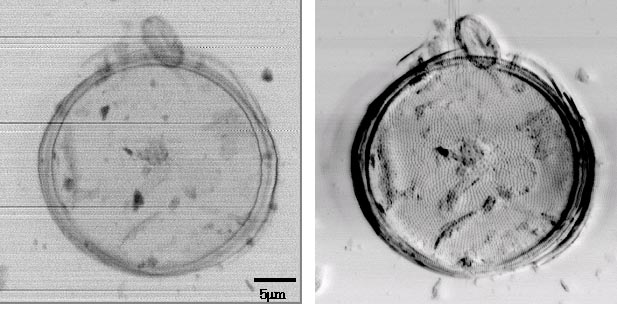
Figure 2: X-ray scanning microscope images of a fossil of diatom.
Left: transmission image, and right: dark-field image.
Source of the figure
Private communication/others
Description
筆者がBL調整の中で撮ったデータ
Technique
Scanning x-ray microscopy experiment is performed by using micro-focus beam generated with Fresnel zone plate optic. The focused beam size is 0.15 - 0.5 micron that is the spatial resolution of the system.
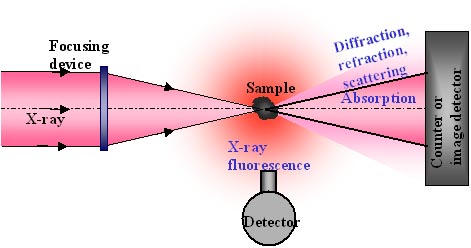
Schematic diagram of scanning x-ray microscopy setup.
Source of the figure
Private communication/others
Description
自作
Required time for experimental setup
2 shift(s)
Instruments
| Instrument | Purpose | Performance |
|---|---|---|
| Fresnel zone plate | x-ray micro-focusing | 0.1 or 0.25 microns theoretical resolution |
| Beam monitor 2 | optical alignment, data acquisition | 4.3 micron pixel size |
| High precision translation stage | sample scan | smaller than 10 nm opration accuracy |
| Silicon drift detector | x-ray fluorescence detection |
References
| Document name |
|---|
| Y. Suzuki et. al., Proc. SPIE, 4499, 74-84 (2001). |
| Y. Suzuki et. al., Jpn. J. Appl. Phys., 40, 1508-1510 (2001). |
Related experimental techniques
x-ray microbeam
Questionnaire
The measurement was possible only in SPring-8. Impossible or very difficult in other facilities.
Ease of measurement
Middle
Ease of analysis
Middle
How many shifts were needed for taking whole data in the figure?
Two-three shifts